The art of predicting the top of a crypto cycle
Bitcoin has historically peaked at 12-18 months post-halving
Daily insights/Shutterstock modified by Blockworks
This is a segment from the 0xResearch newsletter. To read full editions, subscribe.
Predicting the top of a crypto market cycle is as much an art as it is a science.
There’s your Uber driver inquiring about the latest dog coin, a noticeable increase in dodgy celebrity crypto projects, or that cousin you see once a year at Thanksgiving sliding into your DMs for crypto advice.
Here are five tools crypto investors turn to when they dust off the crystal ball every four years. It goes without saying that none of this historical data is a definite guarantee for the future.
Bitcoin halving
Any discussion about crypto cycles is not complete without reference to the quadrennial Bitcoin halving event.
Every approximate four years, the Bitcoin network halves its reward emissions. The latest halving saw network emissions halved from 6.25 to 3.125 BTC.
The halving is the centerpiece of crypto cycles because it has come to be a signal for the beginning of greed and speculation in crypto markets. Importantly, each cycle has tended to peak around 12-18 months after the halving:

We are eight months into the latest halving in April 2024, and if history is a reliable indicator, the 2024 cycle still has ways to go.
Google search for ‘bitcoin’
Hardly a week goes by in the crypto bull market without this chart surfacing on Twitter. It’s a brain-dead simple indicator: Retail wants to keep up to date, and bitcoin is the go-to Google keyword for doing so.
 Source: GoogleTrends
The last peak in bitcoin search interest was in mid-May 2021, about six months before the price of bitcoin actually did top out.
Pi Cycle Top indicator
The Pi Cycle Top is a quantitative measure of bitcoin’s price on two moving averages: 111-day and 350-day (multiplied by two).
Subscribers to the Pi Cycle Top indicator believe the cycle top is in when the former crosses the latter. This has happened with fair accuracy in past bull cycles in 2013, 2017 and 2021.
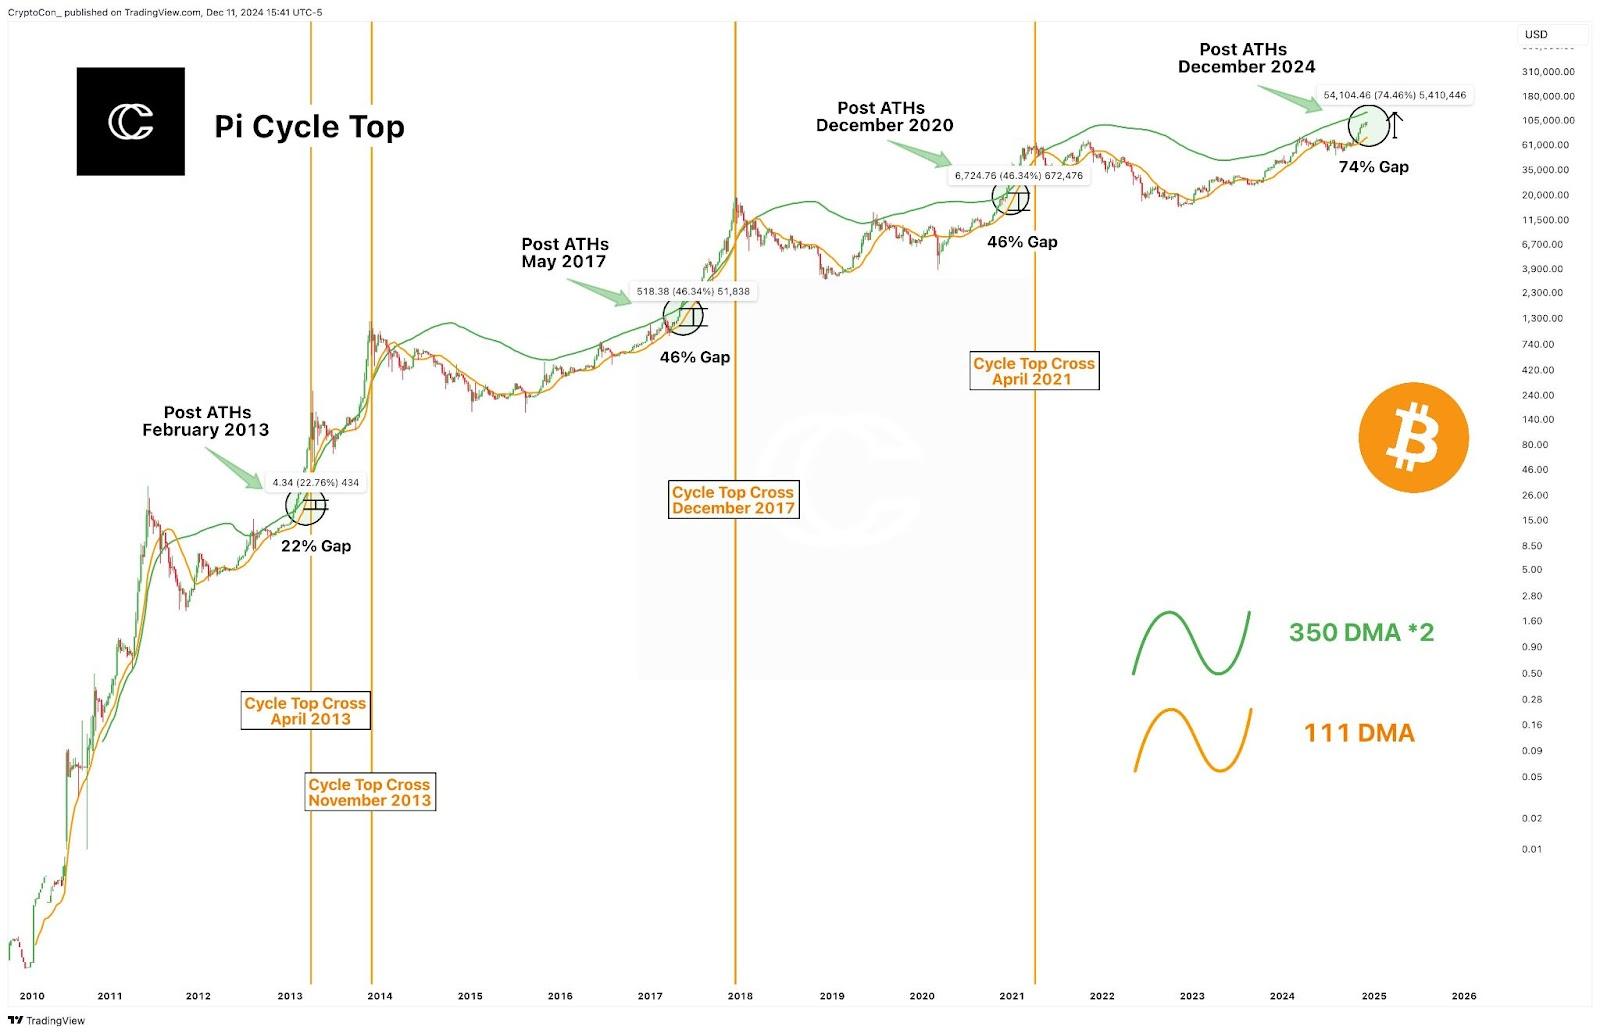 Source: CryptoCon
The indicator rests on a key premise: The end of a bull market is near when everyone and their mom is thinking of getting their hands on the orange coin. This market euphoria drives prices to unsustainable levels above “normal” growth trends, which causes bitcoin prices in the short term to significantly deviate from the long term.
App Store rankings
Premise: First-timers are using Coinbase rather than Uniswap to ape into cryptocurrencies. Implication: When Coinbase ranks highly on App Store rankings, the top of the cycle is near.
Simple enough?
It’s a nifty qualitative measure of crypto sentiment, and there are whole Telegram groups dedicated to just tracking it. In the last week, Coinbase has ranged from 66th to 135th.

With Solana in the limelight again, a popular derivative of this measure has been the Phantom Wallet ranking. The prevailing idea is similar: Retail loves Solana memecoins, so they’re all downloading Phantom on their phones to trade them.
The big assumption with this measure is that crypto investing is still largely untouched by the mainstream, and with every cycle comes a new wave of retail investors that have never installed centralized exchange apps. If crypto is already “mainstream,” this measure loses its relevance.
ETH:BTC ratio
Ah, the revered ETH:BTC ratio that podcasters and investors cannot help constantly obsessing over.
Here’s the idea: Investors buy bitcoin in the early innings of the crypto cycle. Unsatisfied with profits from the orange coin, they soon “rotate” into riskier altcoins, which spikes the ETH:BTC ratio.
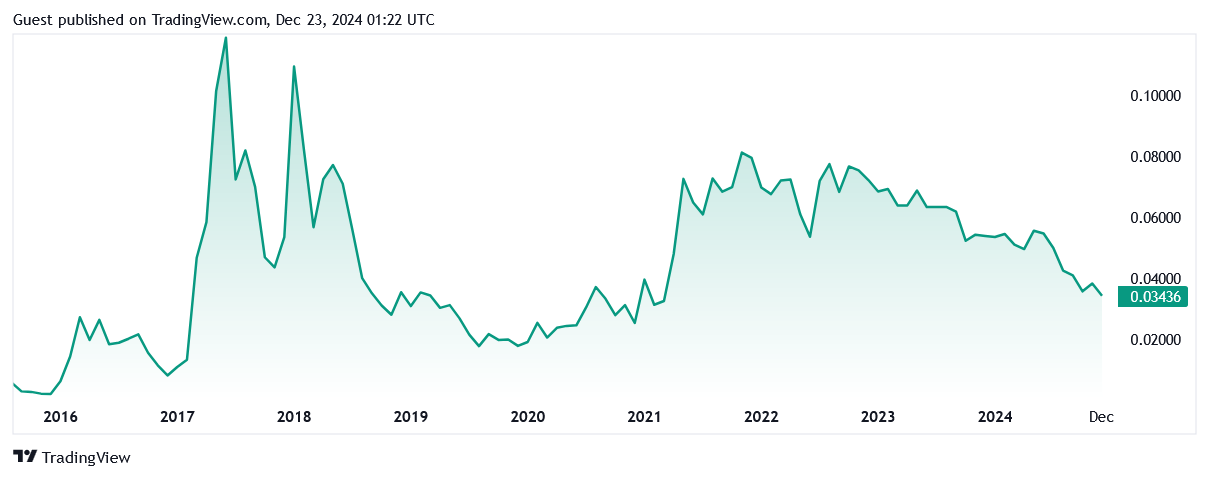 Source: TradingView
With ETH’s sentiment currently in the gutter, ETH:BTC has become a measure of questionable value this cycle. ETH:BTC is currently at a depressing low of 0.034. For context, ETH:BTC peaked at 0.075 in 2022, and 0.0109 in 2018.
If history repeats itself, expect markets to crash when ETH:BTC nears its tops.
Get the news in your inbox. Explore Blockworks newsletters:
- The Breakdown: Decoding crypto and the markets. Daily.
- 0xResearch: Alpha in your inbox. Think like an analyst.
