Insights / Dashboard Primers
Ore: Data Dashboard Primer
The Blockworks Ore dashboard is organized into eight tabs spanning financial performance, buybacks, staking activity, miner’s behaviour, token dynamics and competitive positioning.
By Chiang Yue Jun ·
ORE is a digital store of value launched natively on Solana. Similar to Bitcoin, ORE has a fixed maximum supply of 3 million tokens with no team or insider allocation. Token issuance is governed entirely by immutable smart contracts.
ORE is designed to be self-custodied and used permissionlessly. It resolves the performance, composability, and consensus tradeoffs of prior digital stores of value by leveraging Solana’s high-performance execution environment and native composability.
Mining functions as an on-chain capital allocation system. Every minute, miners deploy SOL across a 5x5 grid. One tile is randomly selected as the winner, with SOL from losing tiles redistributed proportionally to winners alongside 1 newly minted ORE. An additional “motherlode” pool (0.2 ORE minted per round) has a 1-in-625 chance of being distributed to the winning tile each round, introducing reward variability.
Unlike traditional mining where revenue leaks to electricity costs, ORE recaptures miner’s expense through buybacks. 90% of bought-back ORE is buried and 10% distributed to stakers as yield. “Buried” tokens function similarly to burned tokens, except they can be reissued if circulating supply is below the protocol’s maximum supply cap. When buybacks exceed emissions, ORE becomes deflationary. A 10% refining fee on claimed ORE, distributed to holders, further rewards long-term holders over short-term participants.
Dashboard Overview
Our Ore dashboard is organized into eight tabs spanning financial performance, buybacks, staking activity, miner’s behaviour, token dynamics and competitive positioning.
- Financials: Key financials metrics including revenue, volume, production cost and income statements.
- ORE Buybacks: Buyback activity including cumulative buybacks, buybacks cost, token burns.
- ORE Token: Token supply dynamics covering inflation rate, holder distribution, liquidity and circulating supply.
- ORE Staking: Metrics covering staking APY, staking flows, staker composition and liquid staking participation.
- Mining Activity: Mining related metrics including production cost, SOL deployed per round, refining APY.
- Miner Behaviour: Covers miner’s strategy including auto mining adoption, square deployment patterns, miner profitability and behavioural segmentation.
- Investors and Treasury: Includes funding rounds and ecosystem participants holding ORE.
- Competitive Landscape: Market share benchmark against various peers in Solana and consumer sector.
Financials
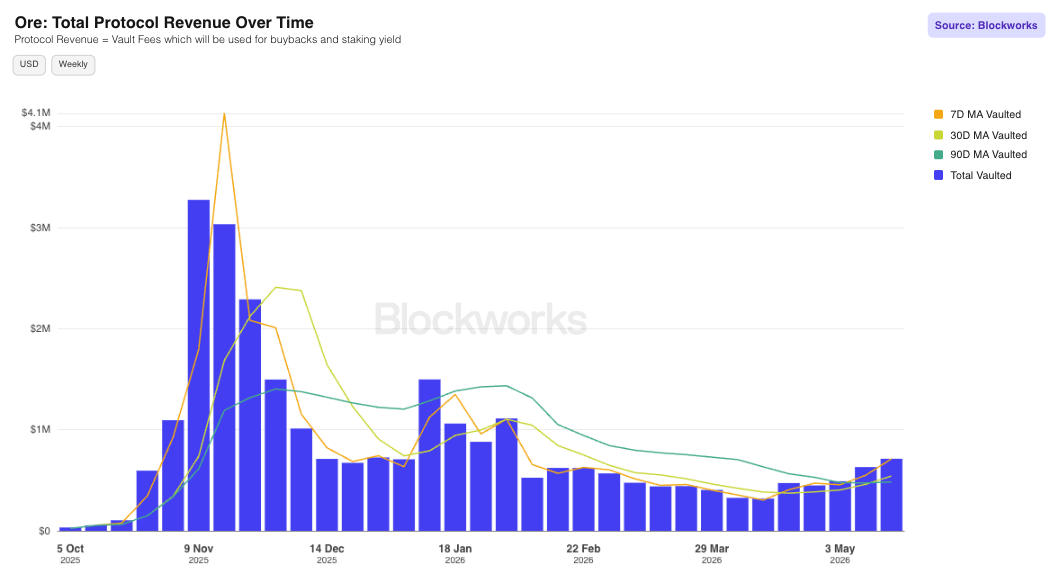
Protocol Revenue: Tracks revenue from vault fees which comes from the 10% fee on SOL deployed on losing squares each round. SOL collected is then used to buyback ORE where 90% is burned and 10% distributed to native stakers as yield.
Weekly revenue has stabilized at ~$600k (~5k-8k SOL), down from the $3.2M peak (~20k SOL) at ORE v3 launch in November 2025 with the USD decline amplified by lower SOL prices.
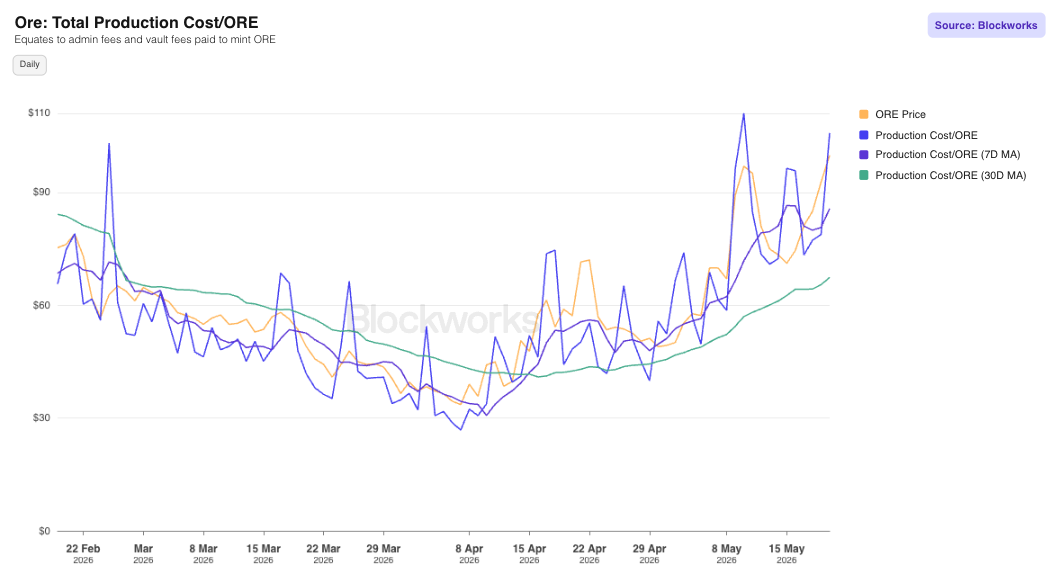
Production Cost/ORE: Measures the total admin and vault fees paid by miners to mint ORE per round which is effectively what miners believe ORE is worth.
When production cost exceeds ORE market price, miners are likely chasing motherlode rewards. In that scenario, buying ORE is more efficient, especially given the 10% refining fee on claimed uORE. Ideally, miners should target rounds where production cost is below market price.
In the long run, production cost should ideally remain slightly above ORE price, as holding uORE compounds refining yield, which makes it more valuable than holding ORE itself.
ORE Buybacks
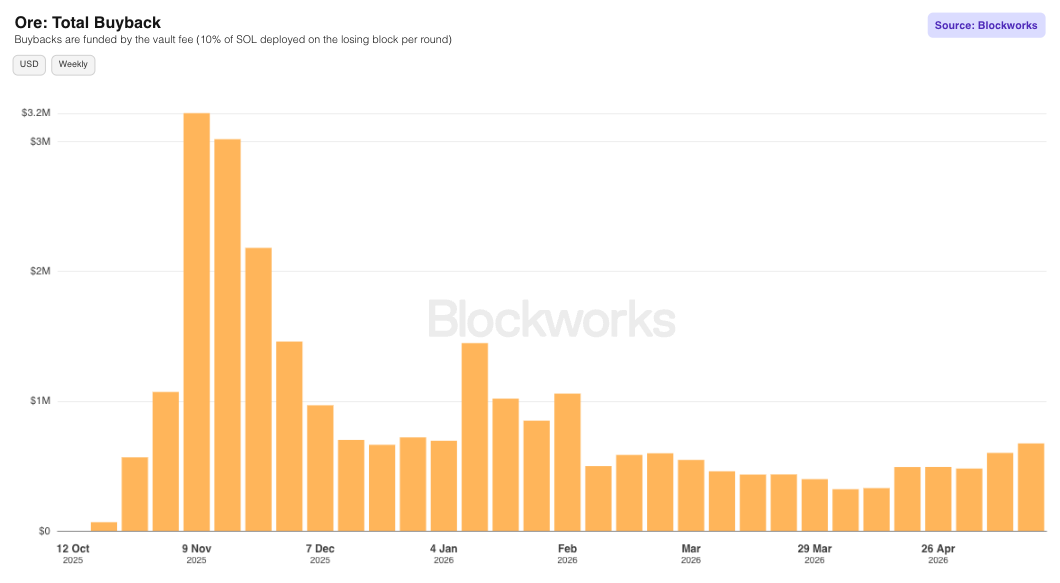
Total Buyback: SOL collected from the vault fees are periodically used to buy back ORE on the open market. Of the ORE bought back, 90% is burnt/buried and 10% distributed as native staking yield.
Buybacks have been active since inception, though weekly volumes have declined from the ~$3.2M peak in November 2025. Volumes have since stabilised, with a slight recovery in late April 2026. Over $27.3M of ORE has been bought back since v3 launch.
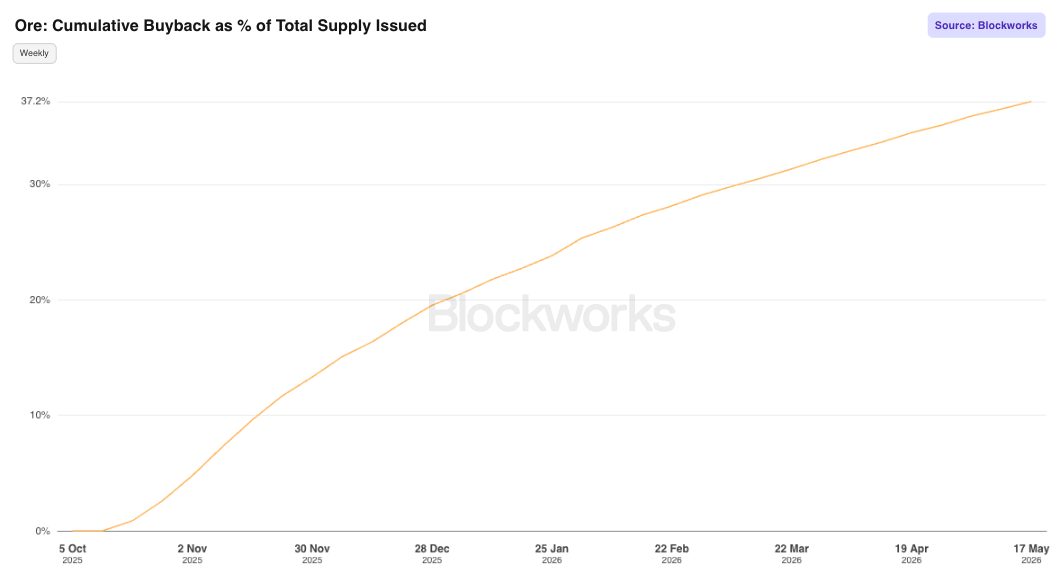
Cumulative Buyback as % of Total Supply Issued: Measures cumulative ORE reacquired through open market buybacks as a percentage of total supply emitted. The key thing to look out for here is the rate of increase as a steeper rise indicates mining activity and protocol demand are absorbing newly emitted supply at a faster pace.
ORE Token
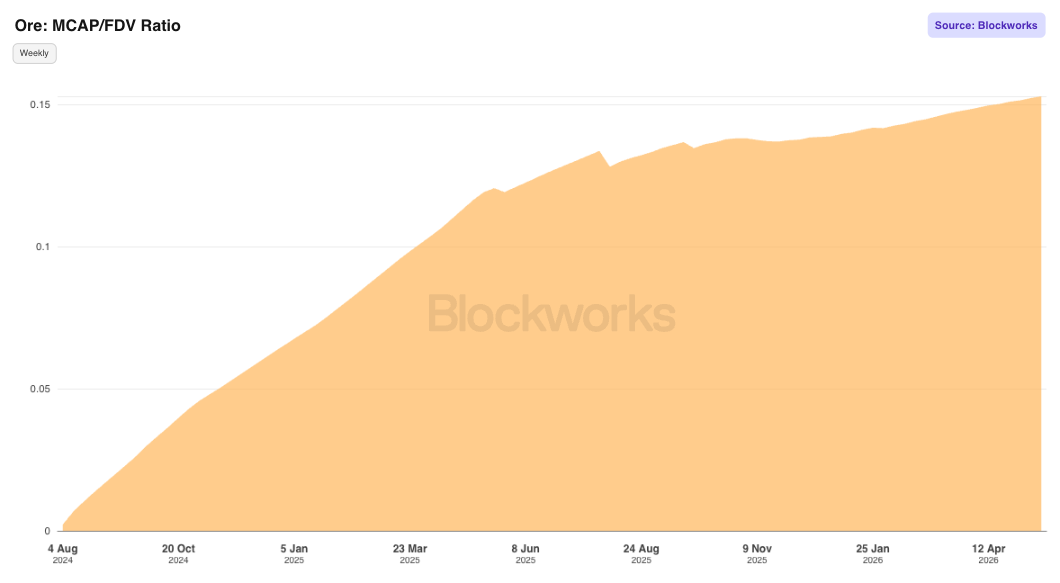
Market Cap/FDV Ratio: Tracks circulating float relative to the 3M max supply (FDV). This ratio has grown steadily to ~15% since v3 launch, reflecting a consistently low inflation rate.
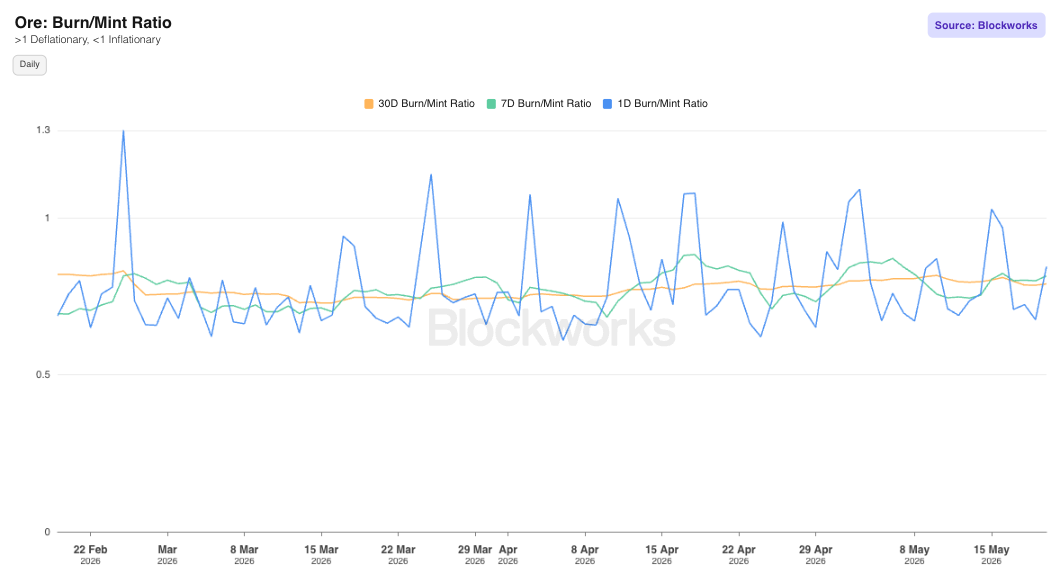
Burn/Mint Ratio: Tracks ORE burned vs minted on a rolling 1D/7D/30D basis. A ratio above 1 = deflationary, below 1 = inflationary. The 30D ratio holds around ~0.8 indicating mild inflationary bias. Occasional spikes on the 1D ratio above 1 are typically driven by higher SOL deployment chasing high motherlode rewards.
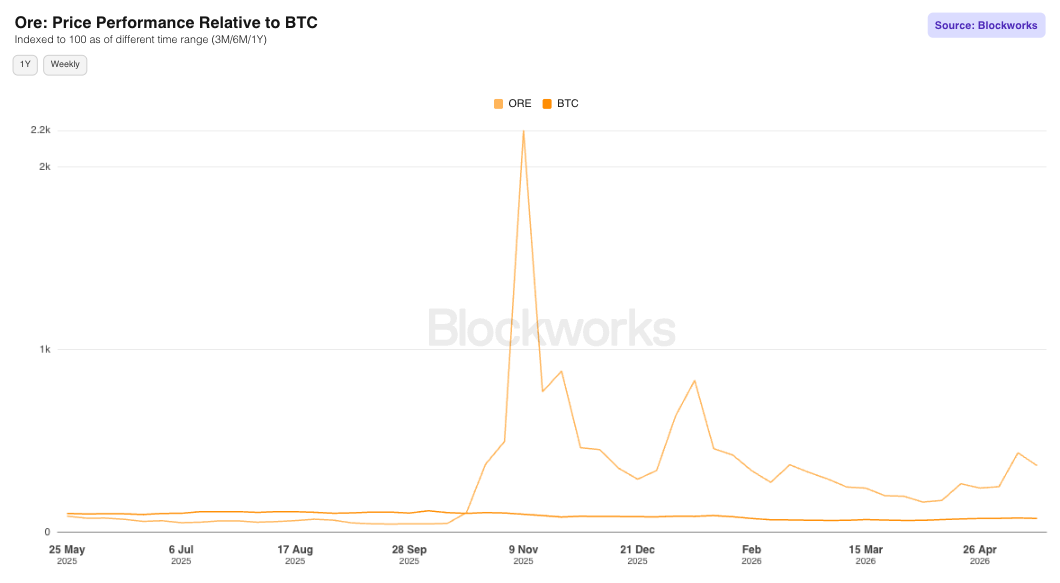
Price Performance Relative to BTC: Indexes ORE and BTC to 100 over the selected time range (3M/6M/1Y) for direct price comparison. On a 1-year basis, ORE peaked at ~23x the base index in November 2025 before retracing, still maintaining a meaningful lead over BTC into May 2026.
ORE Staking
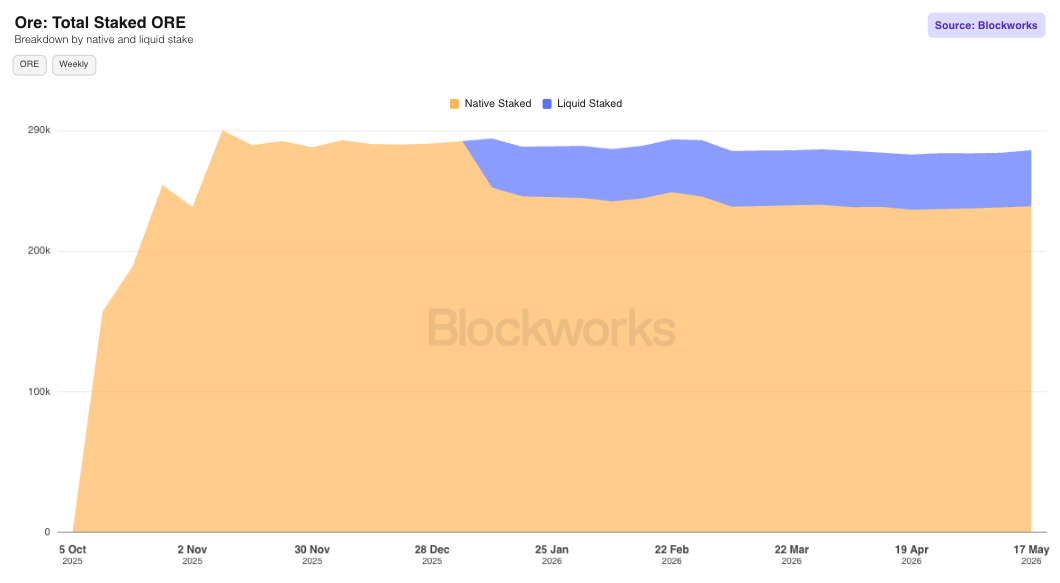
Total Staked ORE: Tracks total ORE staked across native staking and the liquid staking pool (stORE). Over 270k ORE (~$27m) has been staked to date, remaining consistent since v3 launch. ~14.8% is attributable to liquid staking since stORE launched in Jan 2026.
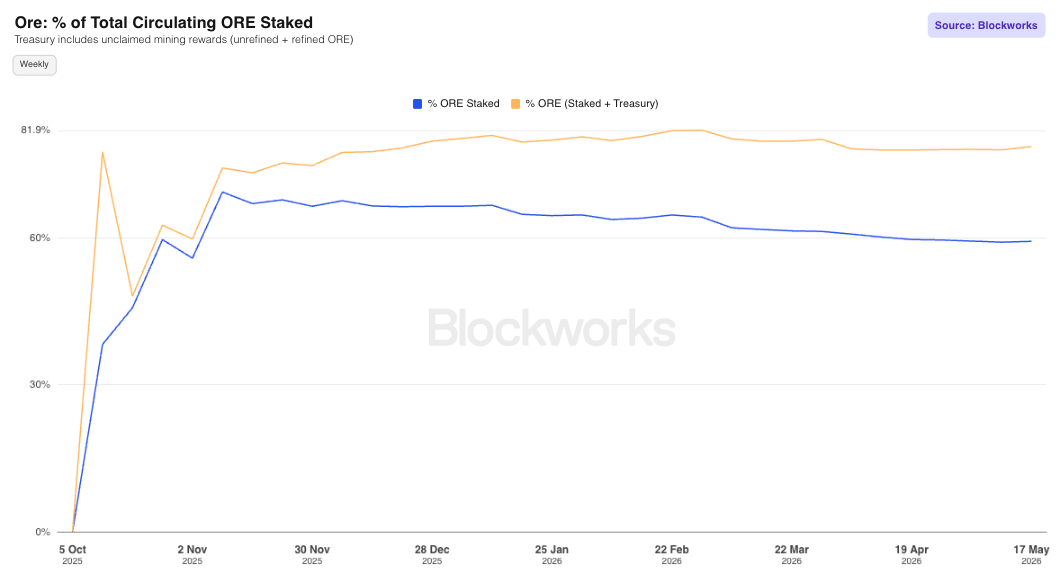
% of Total Circulating ORE Staked: Monitors effective circulating supply by tracking the percentage of ORE currently “locked” up. For the % ORE (Staked + Treasury) view, this includes staked ORE and ORE in the Treasury Wallet (unclaimed uORE + rORE). Since v3 launch, ~81% of circulating supply has been locked, largely driven by the ~17% staking APY (rolling 30D).
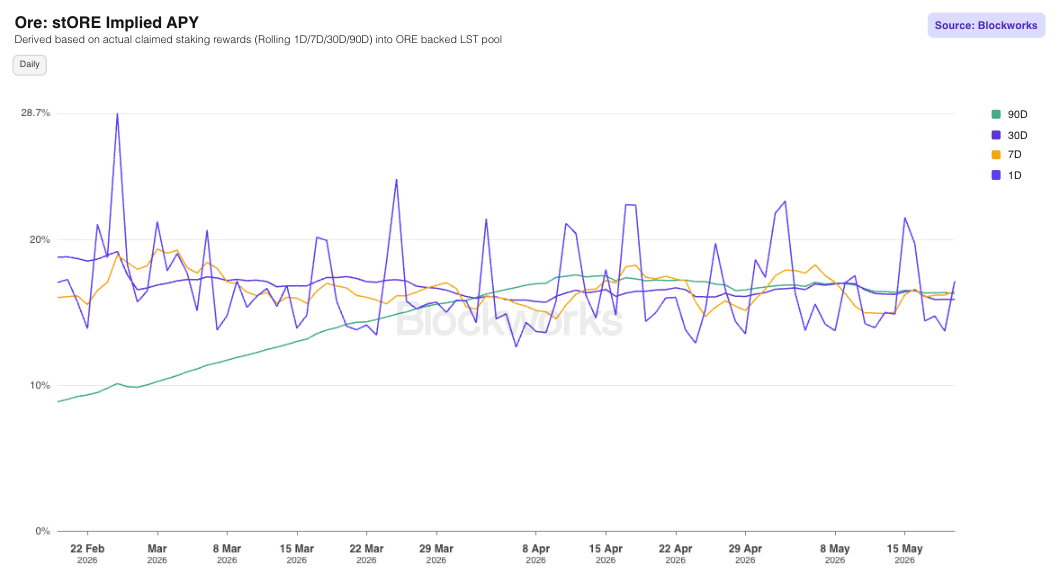
stORE Implied APY: Tracks the implied APY for stORE, which auto-compounds by claiming rewards multiple times daily into the ORE-backed LST pool. Rates are shown on a rolling 1D/7D/30D/90D basis.
On a 90D basis, yield has consistently delivered ~17% APY. The occasional spikes are typically attributed to high motherlode reward rounds. Yield is expected to rise with increased mining activity, though higher buybacks will push up the ORE price, buying fewer ORE per round and naturally rebalancing yield back toward equilibrium.
Mining Activity
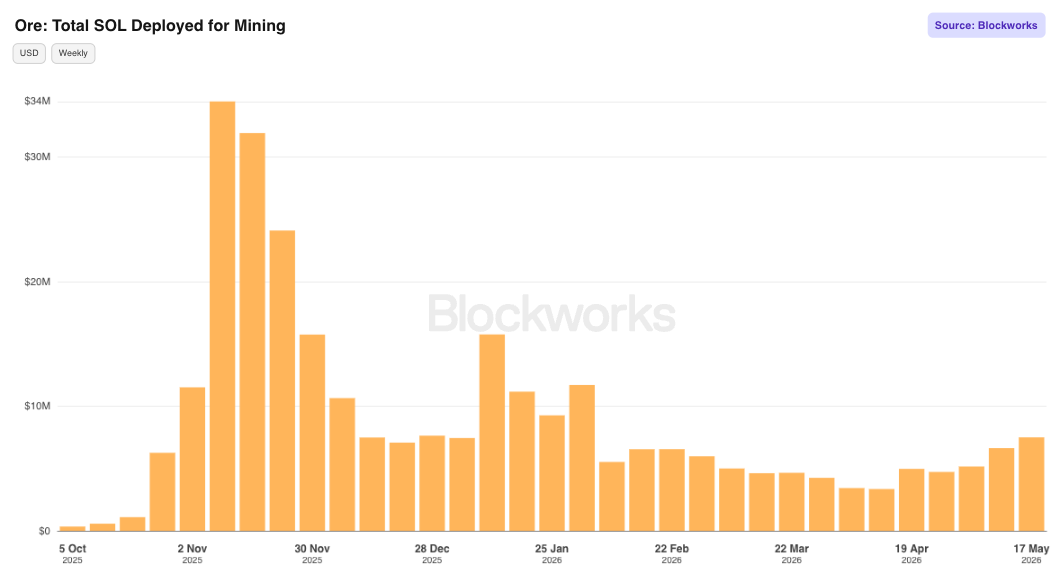
Total SOL Deployed for Mining: Tracks SOL deployed into the mines as a measure of mining activity and how much miners valued uORE. About ~$6-7m SOL is deployed weekly currently, down from the $34m peak at v3 launch (November 2025). On an absolute SOL basis, this is only ~3x below peak (220k vs ~75k SOL/week), with the USD decline amplified by lower SOL prices.
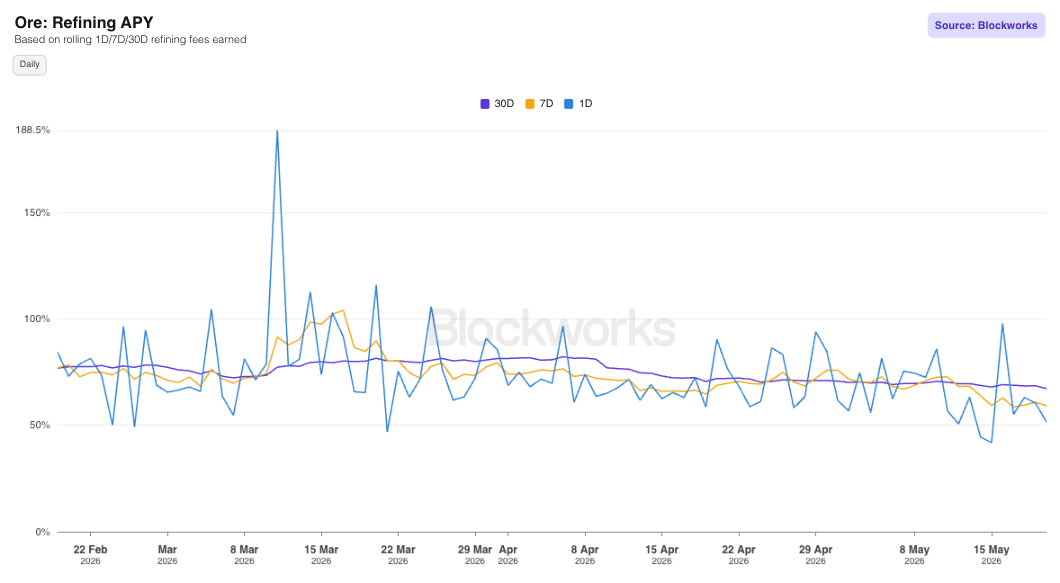
Refining APY: Tracks yield from the 10% refining fee, redistributed to uORE holders as rORE proportional to unclaimed mining rewards. Refining yield has stabilised at ~70% (rolling 30D), ranging 50%-90%+. Higher yield signals more short-term claimers while lower yield indicates more long-term aligned miners.
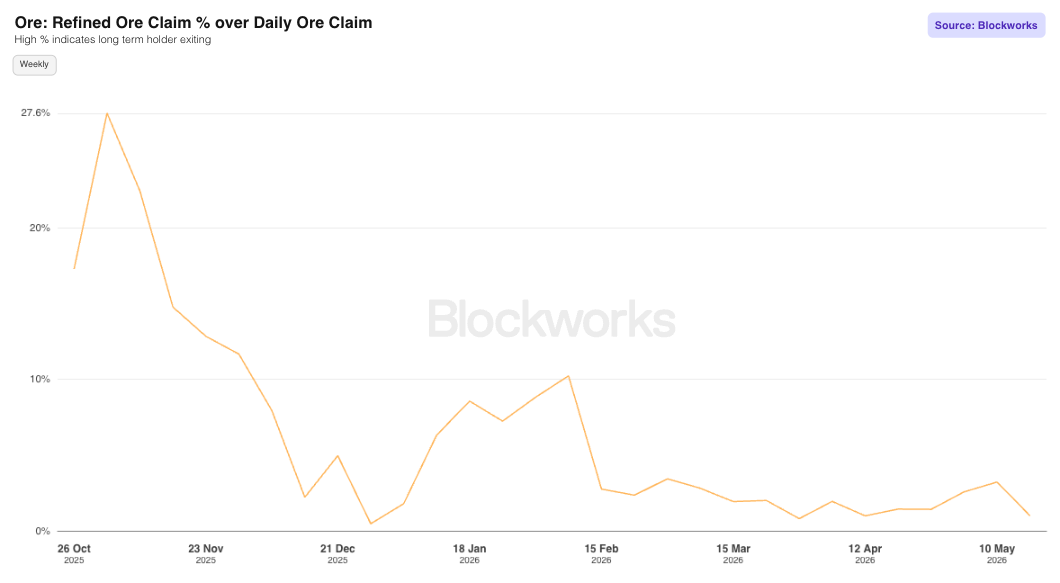
Refined Ore Claim % over Daily Ore Claim: Tracks rORE as a proportion of total daily ORE claims.
Daily claims include:
(1) uORE: subject to the 10% refining fee and
(2) rORE: refining yield earned (not taxed)
A high percentage suggests a long-term holder may be exiting. This ratio has maintained consistently at ~1%, indicating most long-term holders are retaining uORE with no major exits.
Miner Behavior
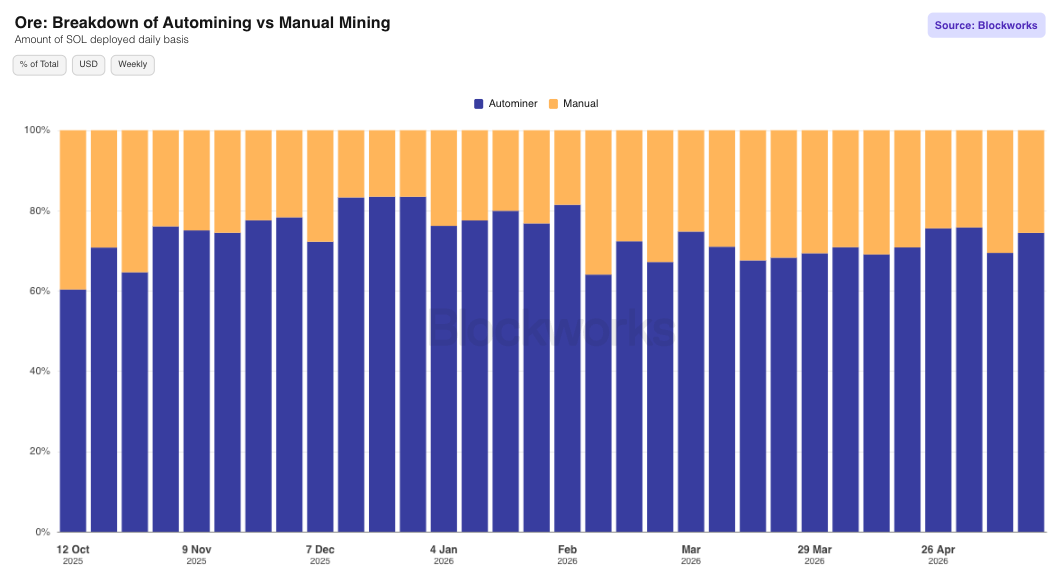
Breakdown of Automining vs Manual Mining: Tracks the split of SOL deployed via automining versus manual mining. Multiple platforms offer automining with preset conditions (rounds, SOL amount, squares). Since v3 launch, autominers have consistently accounted for ~75%+ of weekly SOL deployments.
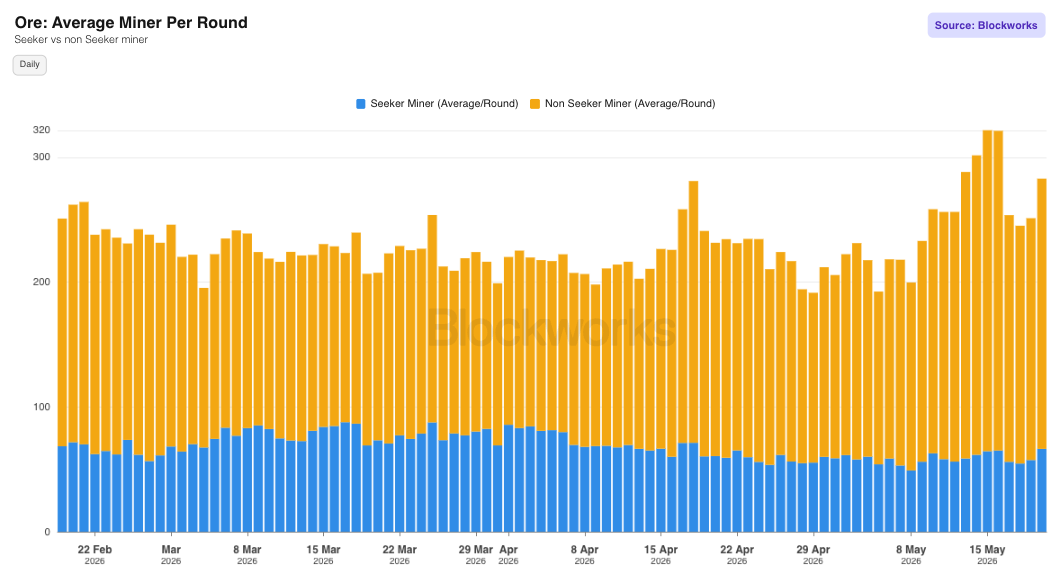
Average Miner Per Round: Tracks average miners per round daily, segmented by Seeker vs non-Seeker. Over 25% mine via Seeker phone, reflecting meaningful mobile adoption, partly incentivised by potential Seeker airdrops.
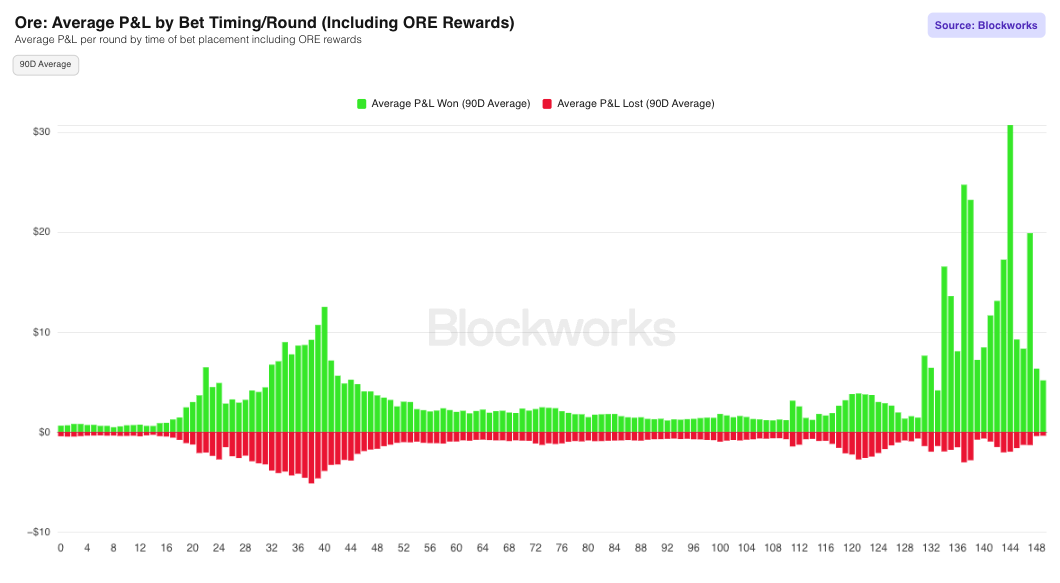
Average P&L by Bet Timing/Round (Including ORE Rewards): Analyzes average miner P&L on a 1D/7D/30D/90D basis for each round, segmented by the timing of SOL deployed within the round.
Across all timeframes, late deployment (last 20+ slots) consistently shows higher average P&L, suggesting informed players gain an edge by monitoring tile EV before committing SOL.
Investors and Treasury
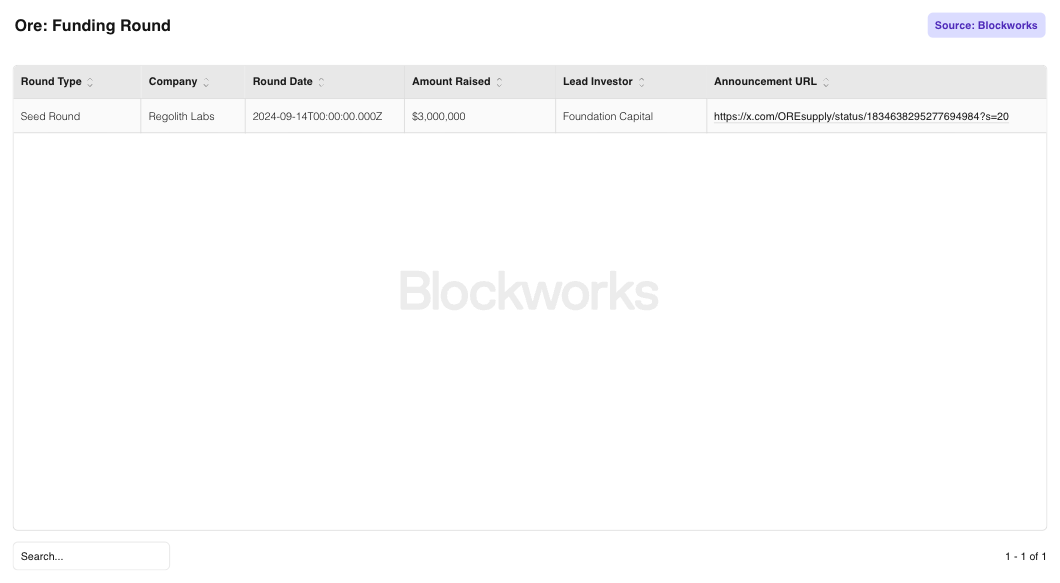
Funding Round: Summarizes the key funding rounds ORE has completed, including Seed Round in September 2024 where $3M was raised.
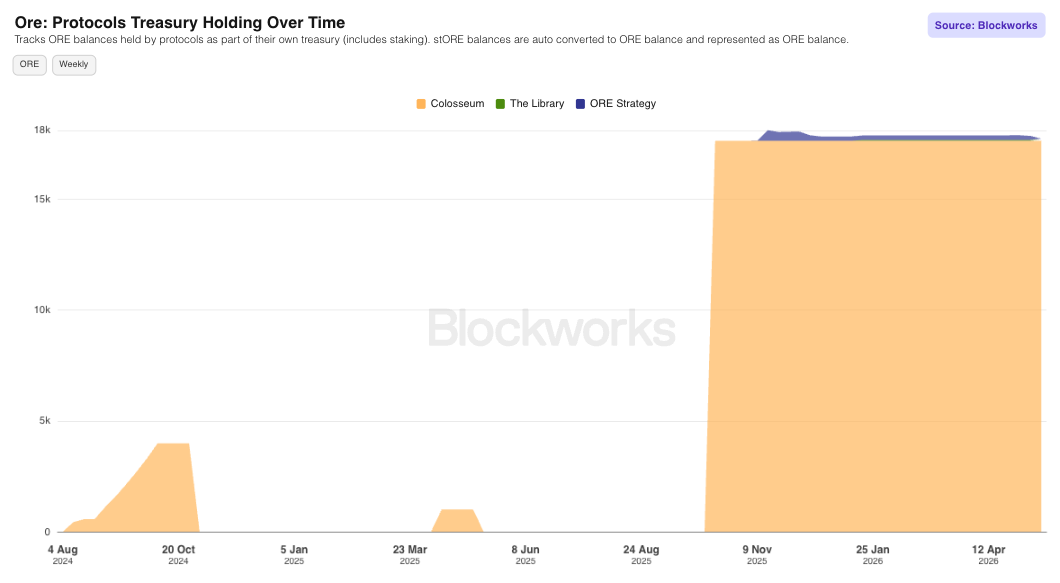
Protocols Treasury Holding Over Time: Tracks Solana ecosystem protocols holding ORE as part of their treasury over time. Holdings include natively staked ORE.
Competitive Landscape
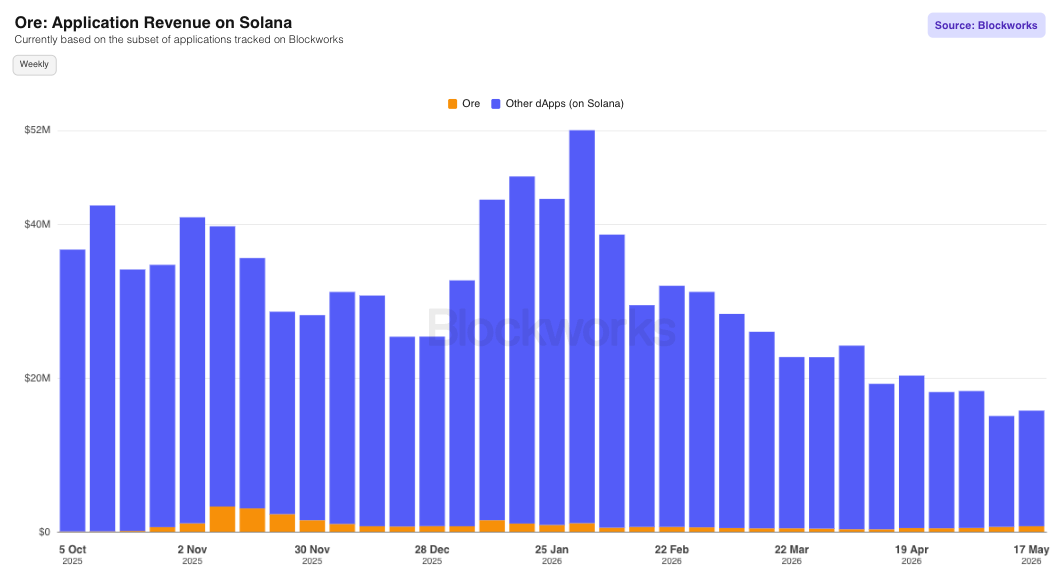
Application Revenue on Solana: Tracks ORE’s protocol revenue relative to other Solana-native applications tracked on Blockworks. ORE currently maintains a ~2-5% weekly share of total Solana application revenue.
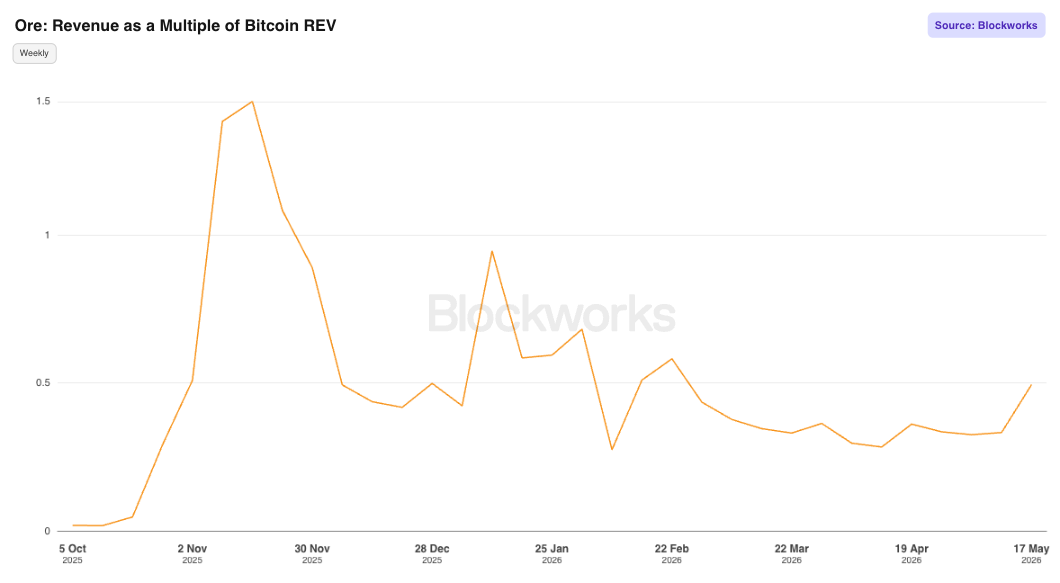
Revenue as a Multiple of Bitcoin REV: Compares ORE’s protocol revenue against Bitcoin’s Real Economic Value (REV). ORE peaked at a 1.5x multiple over Bitcoin REV during November 2025 at peak mining activity. More recently, it has settled at a consistent ~0.4x multiple on a weekly basis which is still competitive given ORE’s significantly smaller scale.
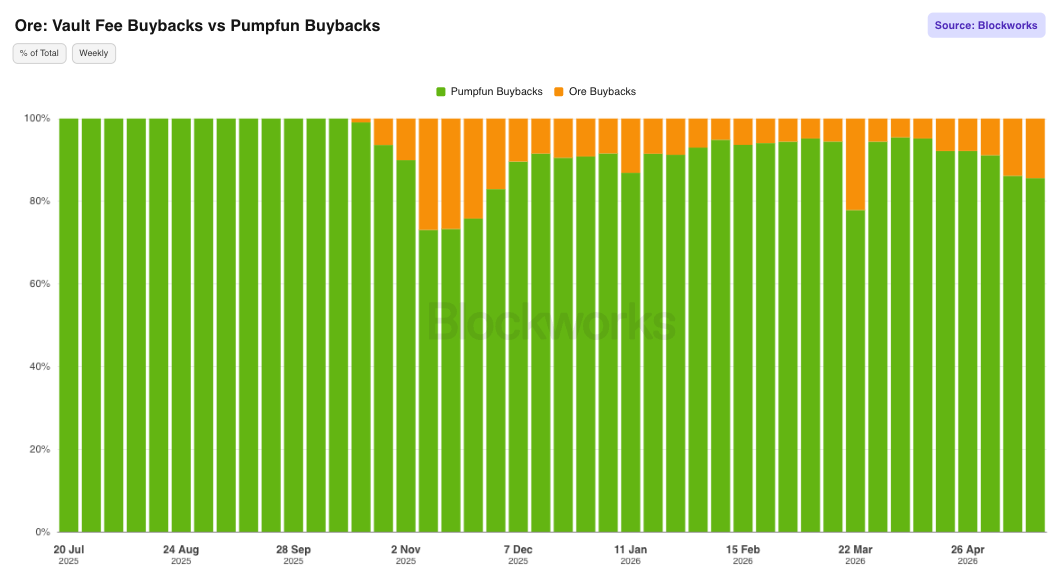
Vault Fee Buybacks vs Pumpfun Buybacks: Compares weekly buyback volumes between ORE and Pumpfun. Despite Pumpfun’s large-scale buyback activity, ORE has remained competitive and consistent, maintaining ~15-20% of combined weekly buyback market share.
The information contained in this report and by Blockworks Inc. and related affiliates is for general informational purposes only and is not intended to provide legal, financial, or investment advice. The report should not be construed as an offer or solicitation to buy or sell any security, token, or financial instrument and does not represent any recommendation or endorsement of any investment or financial product or service. Blockworks Inc. and related affiliates are not registered as a securities broker-dealer or an investment advisor in any jurisdiction or country.
Back to Insights
Newsletter
The Breakdown
Decoding crypto and the markets. Daily, with Byron Gilliam.
Blockworks Research
Unlock crypto's most powerful research platform.
Our research packs a punch and gives you actionable takeaways for each topic.
Blockworks Inc.
133 W 19th St., New York, NY 10011
Blockworks Network
Resources & Legal