Insights / Risk Management
Ethena dynamic cooldown: three months in, one exploit later
As a member of Ethena Risk Committee, we proposed dynamic cooldown for sUSDe approximately three months ago. The design principle is based on linking the cooldown tenor to the real-time liquidity depth of USDe's backing portfolio rather than fixed at an arbitrary interval. When backing depth is sufficient, a one-day cooldown is supported by the coverage data. When available backing diminishes and redemption pressure rises, the framework extends the tenor automatically, before a coverage breach occurs. On March 16, 2026, the framework went live. The 89 days of post-launch data, including one genuine stress event, constitute the first empirical record of its performance.
By Blockworks Advisory ·
Key takeaways:
- The framework held under a genuine stress test. The rsEth exploit generated $1.97B of cumulative redemptions over six consecutive days. Tier 1 absorbed a 51.9% drawdown and the coverage implied cooldown was one day throughout.
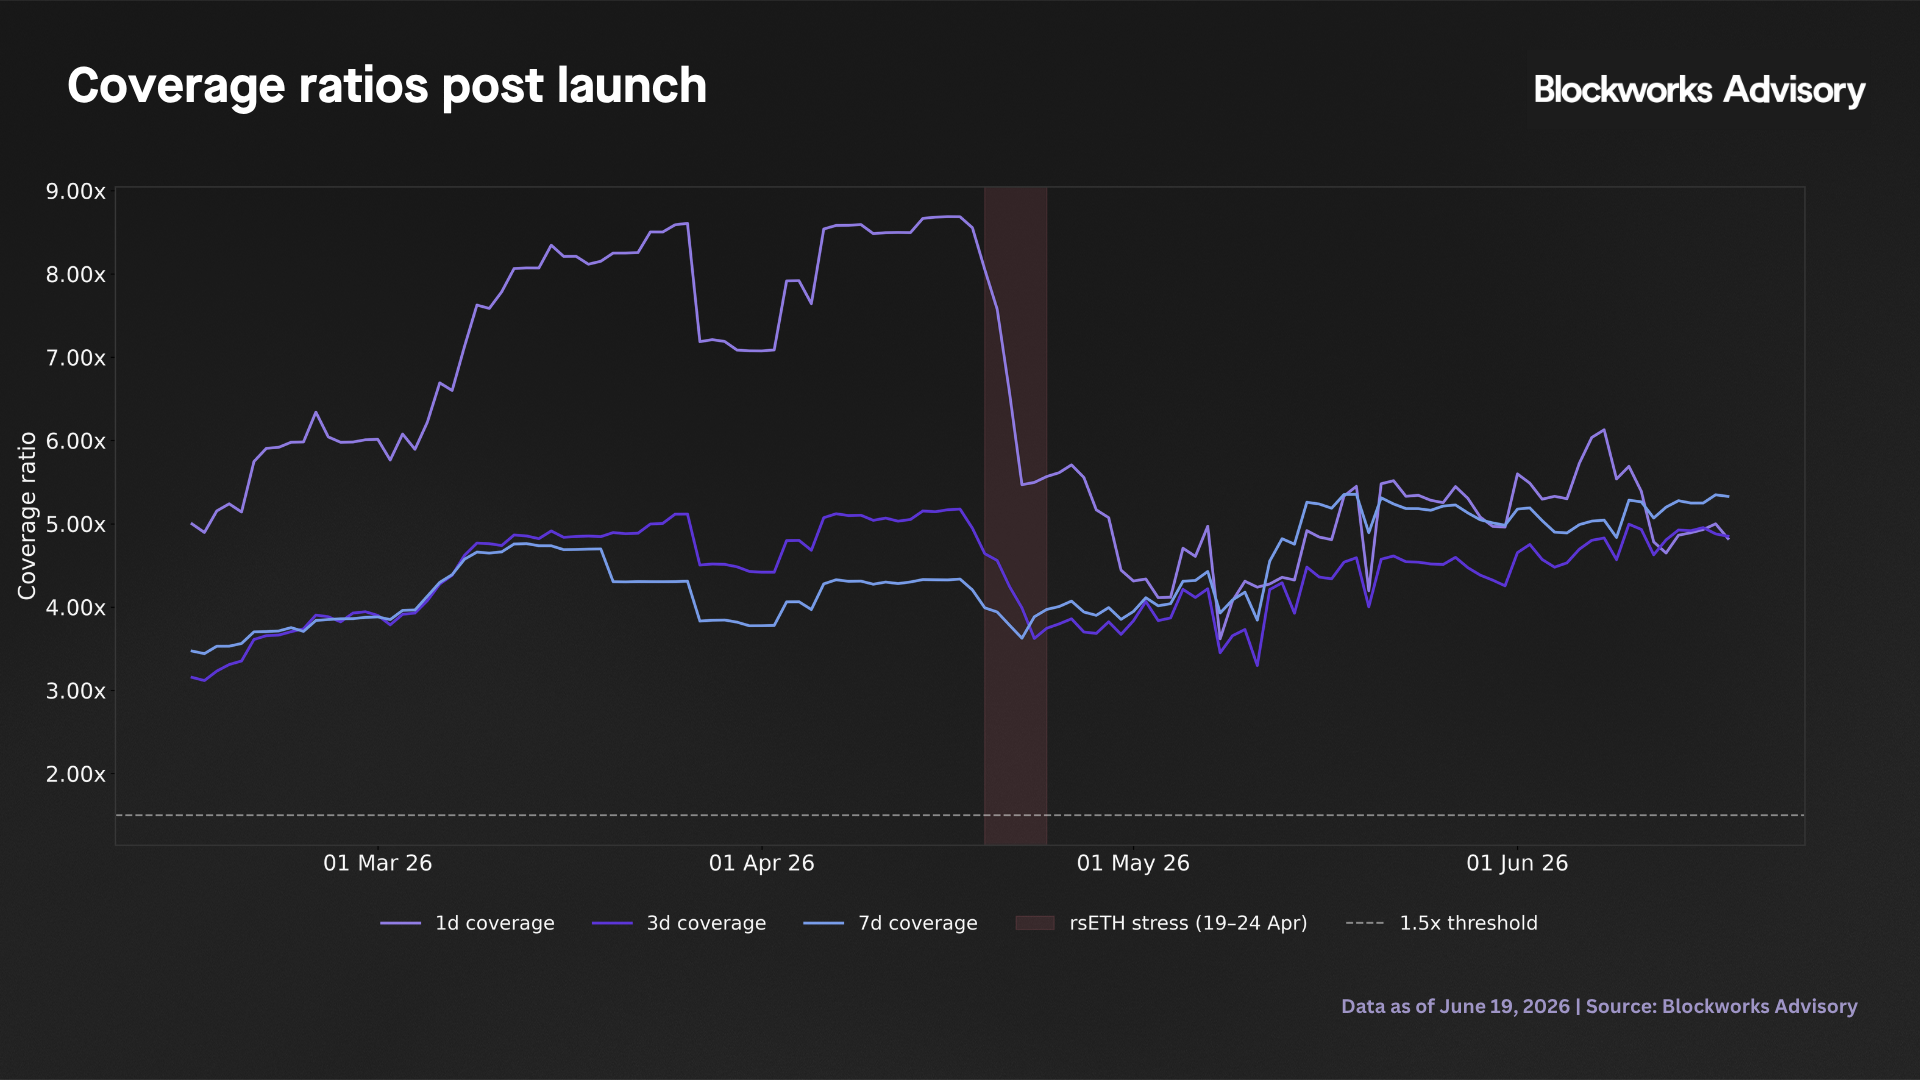
- Coverage multiples were the correct lens. Minimum one-day coverage during the stress window was 5.74x and minimum headroom above the required buffer floor was $1.08B. The system had substantial margin even at its tightest point.
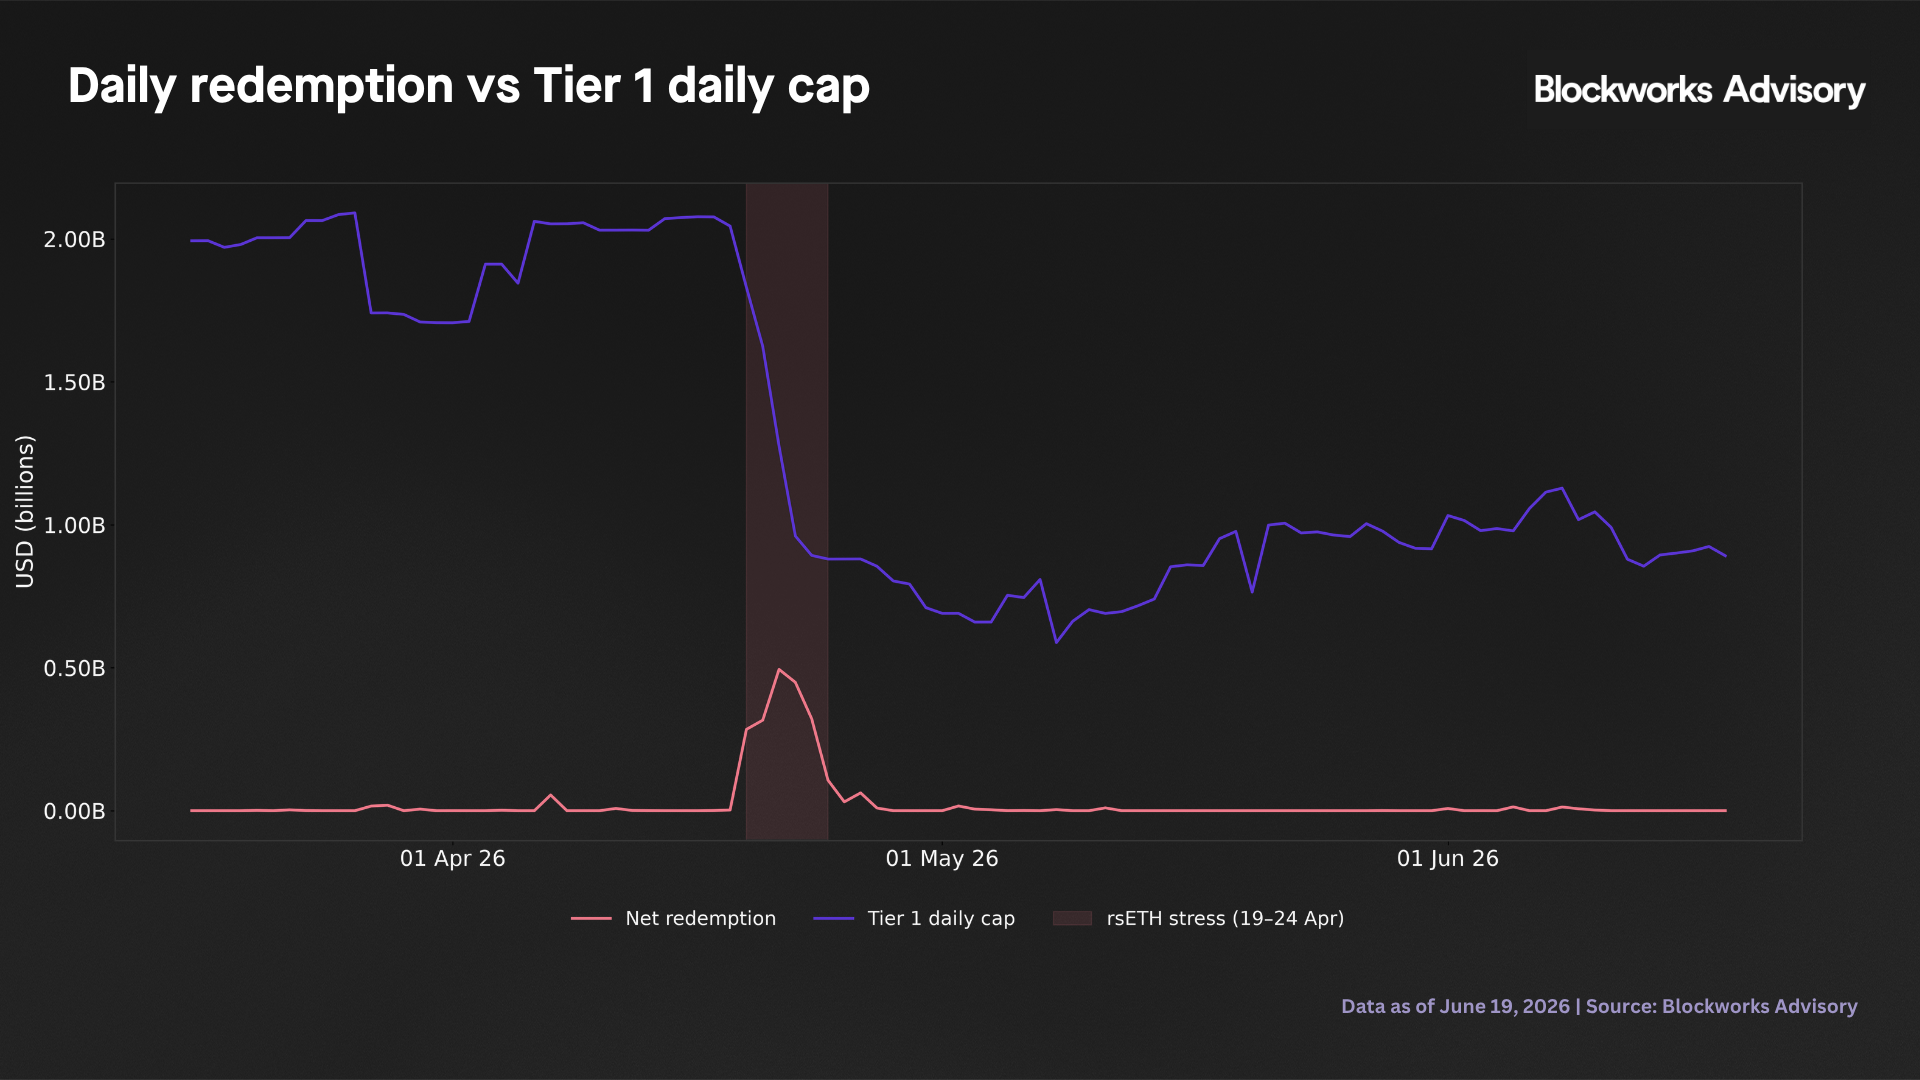
- Tier 1 daily cap held on every redemption day. Peak utilization was 46.7% on April 22 and 100% of redemption days cleared the cap. This is the cleanest proof that the framework’s implied throughput limit was never challenged.
Framework mechanics
The framework maps the sUSDe unstaking tenor to three tiers of backing liquidity. Tier 1 covers blue-chip stablecoins, mint/redeem balances, and the USDtb instant buffer, comprising assets accessible within one day. Tier 2 covers yield-bearing stablecoins (if any) and withdrawable lending exposure, accessible within two days. Tier 3 is the residual loan book, with a five-day settlement horizon.
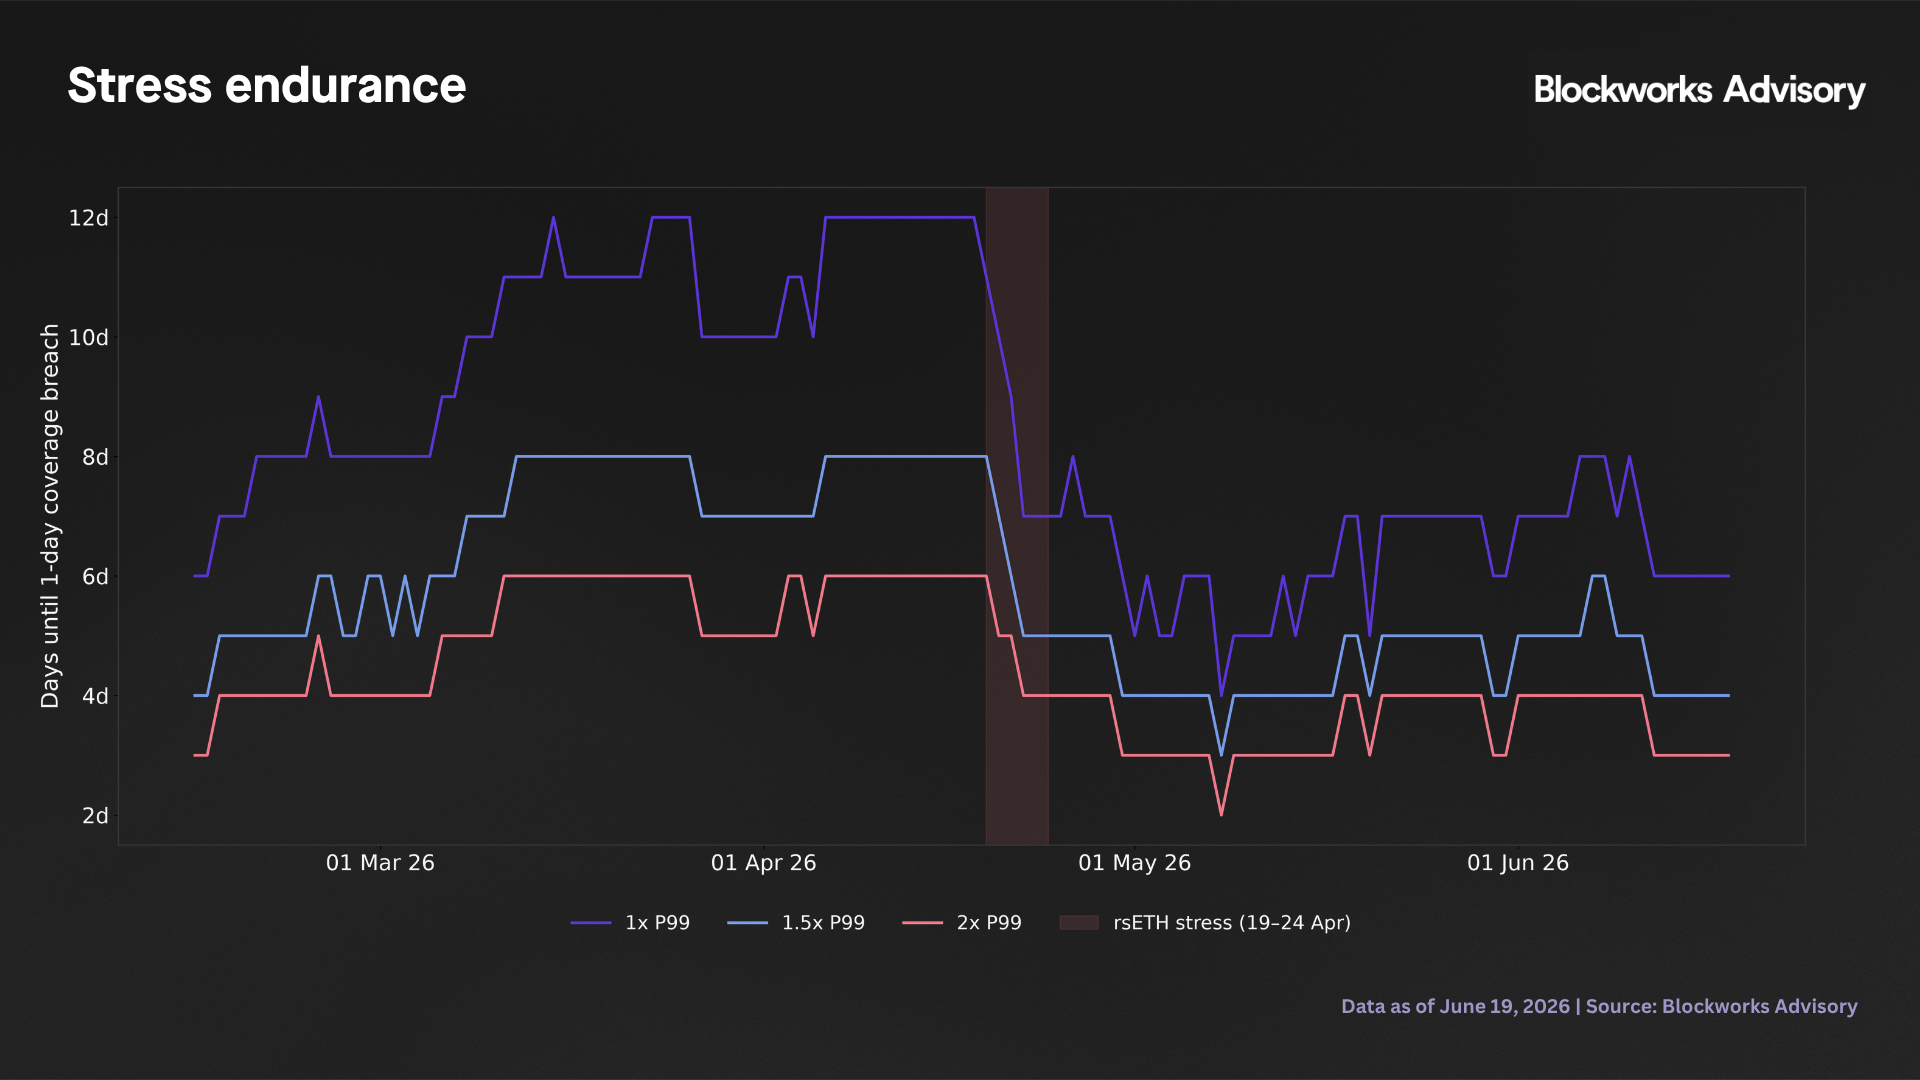
Coverage is measured against empirical P99 redemption benchmarks, which is 4.1% of USDe supply redeemable in one day, 9.2% over three days, and 12.0% over seven days. Each benchmark is scaled by a 1.5x safety factor before becoming the required buffer floor. The recommended cooldown tenor follows from tier coverage: if Tier 1 assets alone satisfy the P99 one-day benchmark at the required margin, the framework prescribes a one-day cooldown. If coverage tightens such that Tier 2 or Tier 3 assets are needed to meet the buffer, the tenor extends accordingly.
The framework incorporates a queue pressure overlay, a counterfactual escalation rule that would extend the recommended cooldown to three days upon consecutive P95 unstake escalation days. The overlay requires consecutive escalation where a single elevated day is insufficient. The overlay is a monitoring signal and a model output, and Tier coverage is the binding policy metric.
Pre-launch baseline
The 30 days preceding launch establish the baseline conditions. Mean three-day coverage was 4.02x with Tier 1 averaging around $2.37B. The coverage-implied cooldown was one day throughout the full pre-launch window. Queue surge days occurred on two of the 30 pre-launch days (6.7% of the period), but the consecutive P95 escalation threshold was never crossed, and the queue aware cooldown also remained at one day (queue pressure averaged 0.68x). These are the system conditions the framework inherited at launch.
Over the 89 post-launch days, mean three-day coverage rose from 4.02x to 4.55x, driven by liquid backing growing alongside USDe supply as it approached and moved above approximately $5.9B. The coverage implied cooldown was one day on every post-launch observation. Minimum Tier 1 headroom above the required one-day buffer was $638M across the full post-launch period, placing the system clear of any policy floor approach under ordinary conditions.
The rsETH stress episode
The rsETH exploit in late April generated correlated liquid staking redemption flow across DeFi. Elevated USDe redemptions began on April 19 and continued through April 24, a run of six consecutive days of net outflow totaling $1.97B cumulative. The peak single day figure was $494M on April 21. The episode was not a routine period of elevated unstaking; it reflected coordinated, correlated withdrawal pressure driven by an external shock to the broader liquid staking ecosystem.
Ethena maintained a one-day operational cooldown throughout the six-day window, consistent with the preceding weeks. The coverage data supports that operational position since mean three-day coverage during the stress window was 4.13x and mean one-day coverage was 6.46x. The minimum one-day coverage across the six days was 5.47x, recorded on April 22, when $449M of net redemption cleared and queue pressure reached 3.87x. Every day in the window satisfied the SAFE threshold on the three-day horizon. No observation approached the required buffer floor at which a cooldown extension would have been warranted.
Tier 1 drawdown
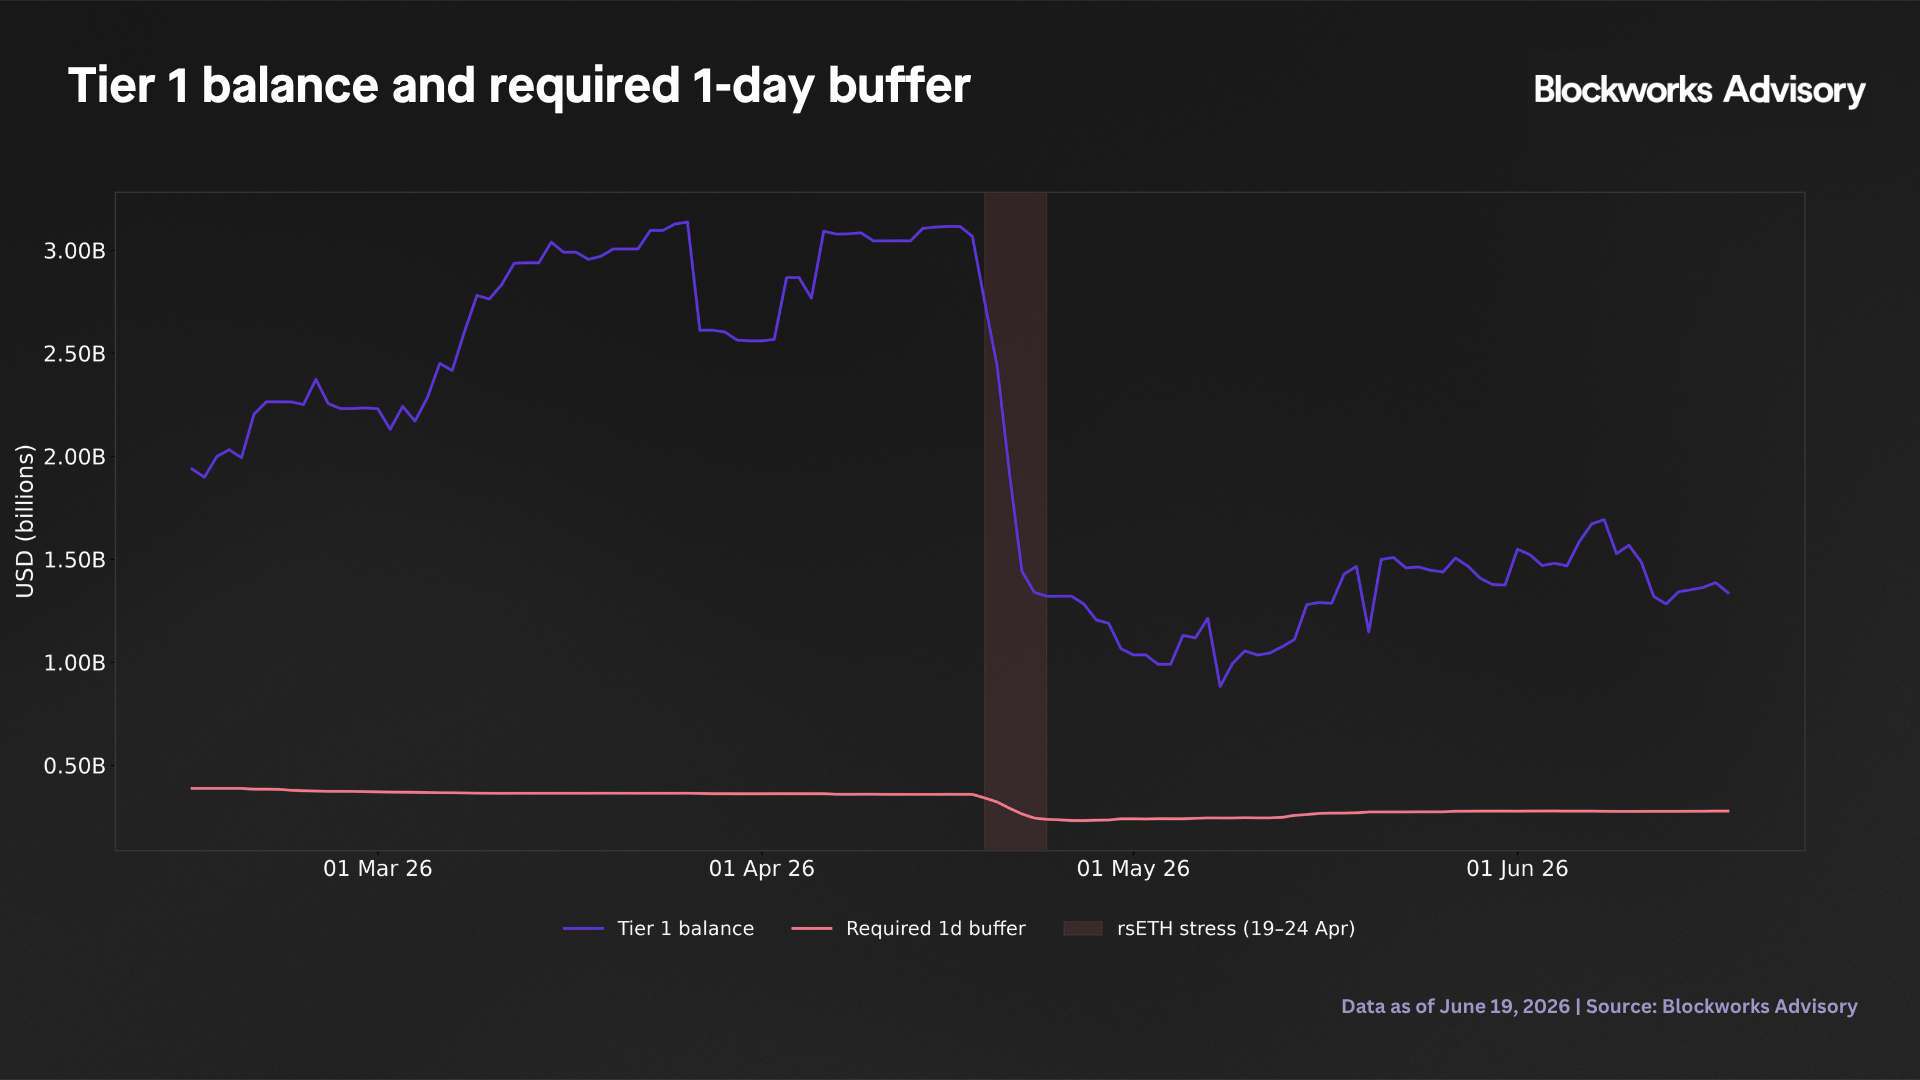
Coverage multiples are the policy-relevant measure. The Tier 1 balance trajectory warrants separate examination because it quantifies how much of the buffer was consumed during the episode.
Tier 1 contracted from $2.75B on April 19 to $1.32B on April 24, a 51.9% decline over six days representing approximately $1.43B of absorbed buffer. Tier 1 contracted materially, but the operative question is whether it stayed above the one-day cooldown floor at every point in the window. The required one-day buffer equals 1.5 × 4.1% × USDe supply. At the tightest point on April 24, headroom above that floor was $1.08B.
Observed redemption flow remained at or below the Tier 1 daily cap (Tier 1 divided by 1.5) on every day of the six-day window. Peak cap utilization was 46.7% on April 22 and all six days cleared the daily cap test.
Day-by-day breakdown:
April 19. Tier 1 at $2.75B. One-day coverage 8.05x, three-day coverage 4.64x. Net redemption $284M, representing 15.5% of the Tier 1 daily cap. Queue pressure reached 12.45x, the highest reading of the episode, and the surge flag triggered. The consecutive P95 escalation condition was not satisfied on day one of the episode; the overlay therefore prescribed a one-day cooldown. Operational cooldown: one day.
April 20. Tier 1 declined to $2.44B as $317M of redemptions cleared. One-day coverage 7.58x. With the P95 escalation condition satisfied for the second consecutive day, the overlay triggered for the first time and prescribed three days. Ethena maintained one day operationally. At 7.58x one-day coverage, no coverage based rationale for extension existed.
April 21. Peak redemption day of the episode. $494M of net outflow brought Tier 1 to $1.91B. One-day coverage 6.57x, three-day 4.25x. Redemptions reached 38.8% of the Tier 1 cap. The overlay continued prescribing for three days. Coverage remained within the SAFE range; the operational cooldown stayed at one day.
April 22. Minimum coverage day of the episode. $449M of redemption reduced Tier 1 to $1.44B and one-day coverage to 5.47x. Headroom above the one-day buffer floor was $1.18B. Redemptions reached 46.7% of the Tier 1 daily cap, the highest utilization of the episode. Coverage remained within the SAFE range on both the one-day and three-day horizon.
April 23. Redemption volume fell to $322M. Tier 1 continued contracting to $1.34B as prior balances settled. One-day coverage 5.50x, three-day 3.62x. The three-day reading was the lowest of the episode and remained 2.41x above the required buffer floor.
April 24. $107M of redemptions, the lightest day of the window. Tier 1 closed at $1.32B. One-day coverage 5.57x. Headroom above the one-day buffer floor of $1.08B. Queue pressure fell to 1.10x; the P95 escalation condition remained technically active while the surge flag cleared.
Queue overlay: counterfactual and operational
The queue pressure overlay merits direct examination because it is the mechanism most susceptible to misinterpretation.
On April 19, queue pressure reached 12.45x, the highest reading of the episode. The overlay did not trigger because the consecutive P95 escalation condition requires more than a single day of elevated activity. From April 20 through April 24, the escalation condition was satisfied each day and the overlay prescribed three days throughout. The counterfactual mean cooldown across the full six-day window was 2.67 days.
Ethena applied a one-day cooldown throughout, where the binding policy metric is tier coverage, which remained within the SAFE range every day. The overlay functions as a monitoring signal indicating elevated redemption pressure, not as an autonomous trigger for extension. The decision to maintain one day, supported by coverage data showing $1.08B of headroom at the tightest point, is consistent with the framework's stated design.
Mint/redeem contract liquidity
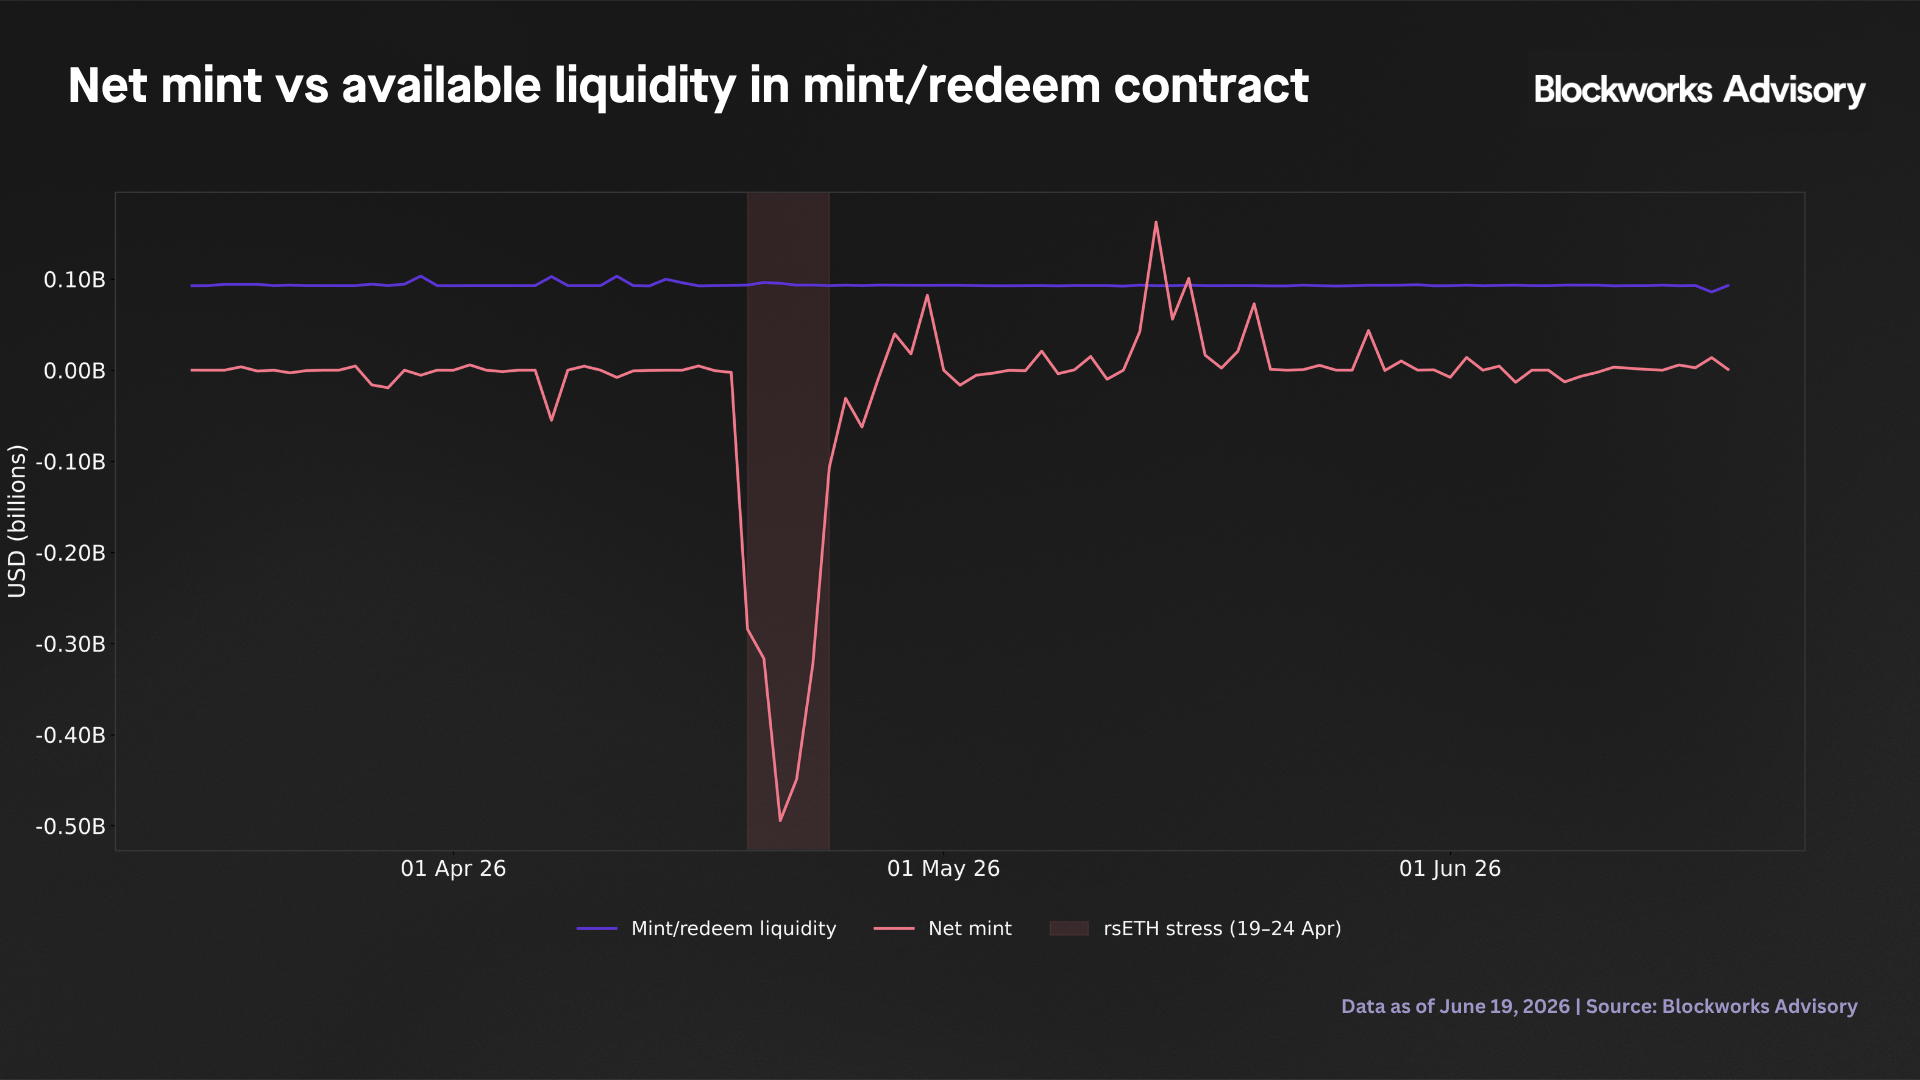
The tier coverage framework does not directly capture the mint/redeem contract's liquidity-to-redemption ratio — available contract liquidity relative to same-day redemption flow. Post-launch mean available liquidity in the contract is $92M; during the stress window, it was $94M against $329M of mean daily net redemption, a 0.36x ratio on net redemption days and 0.19x on the April 21 peak.
This is by design: the contract is a flow intermediary, not a reserve pool, and is not sized to hold collateral in proportion to daily redemption volume. That the contract balance fell well short of daily redemption volume confirms the tiered backing structure — not the contract balance itself — absorbed the six-day shock. Both metrics serve distinct monitoring purposes and neither substitutes for the other.
Post-stress trajectory
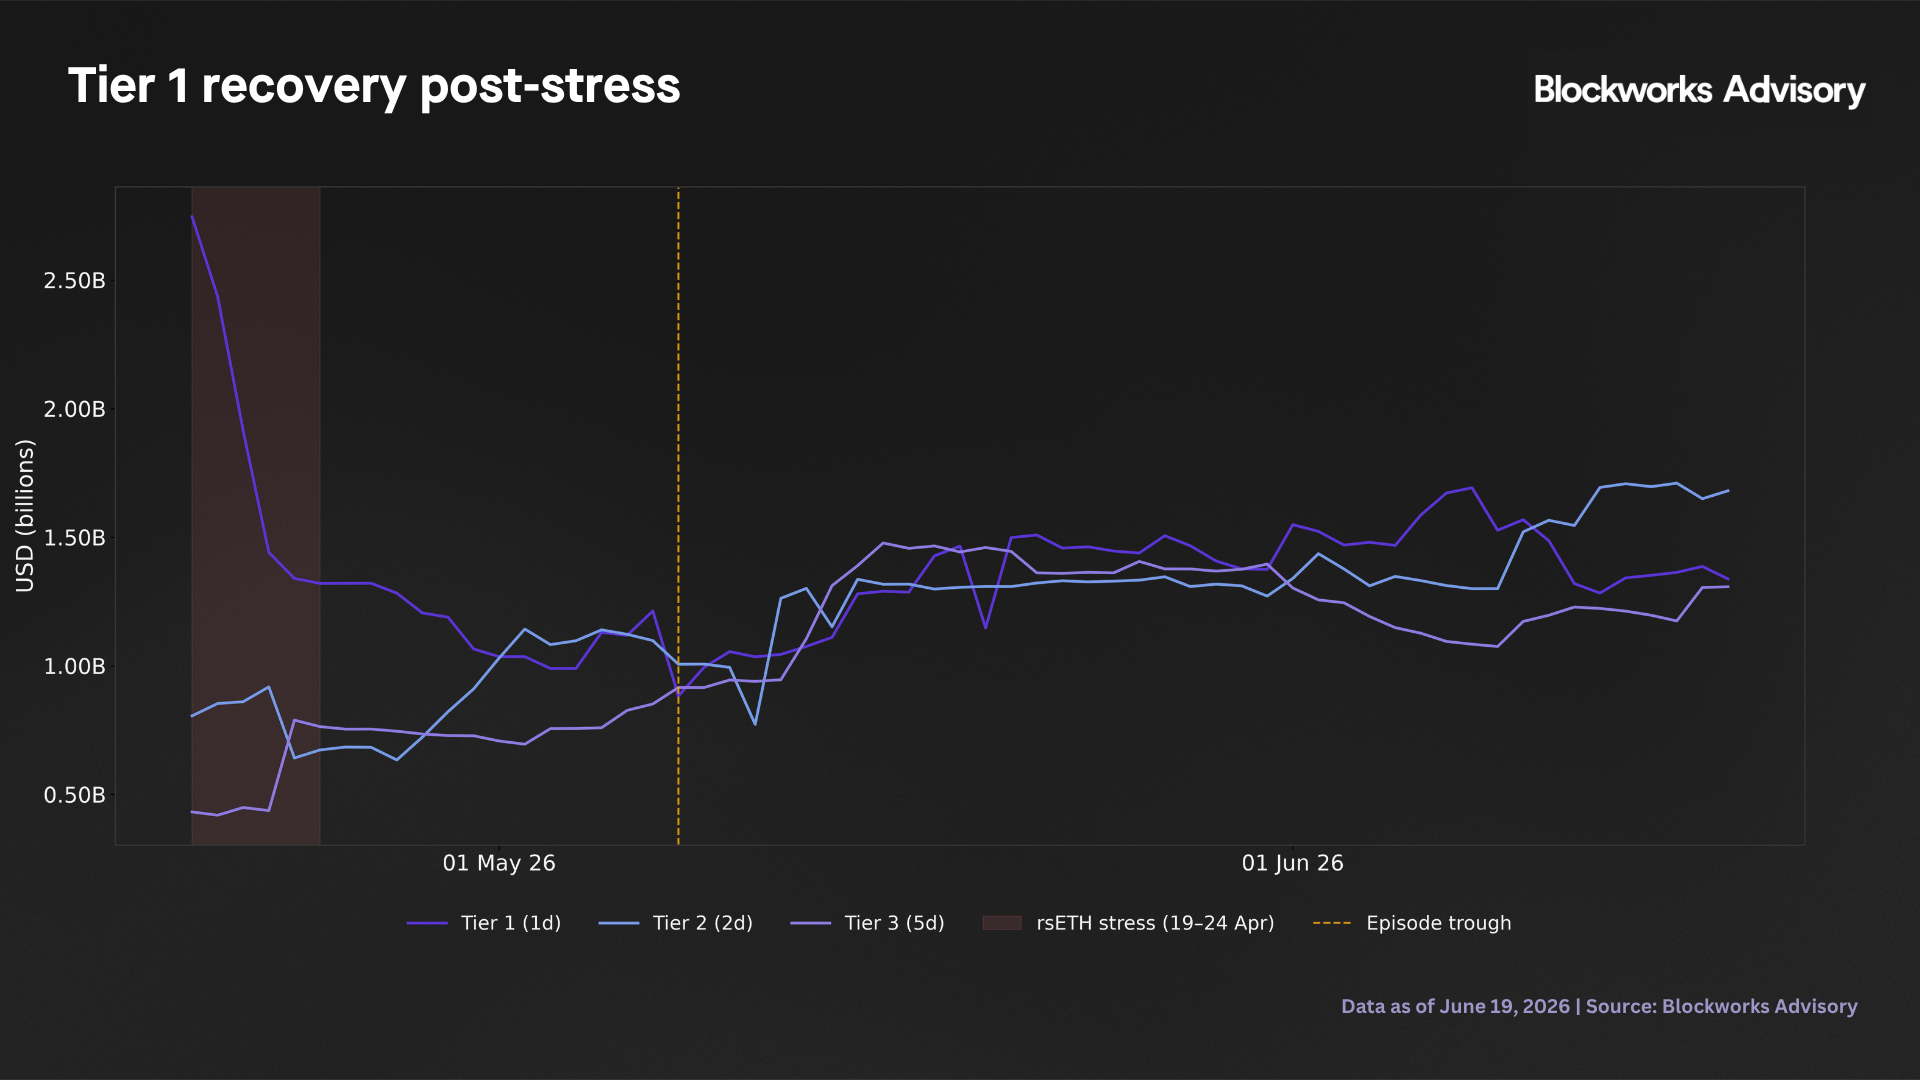
Tier 1 continued contracting after the formal stress window closed on April 24, reaching a trough of $882M on May 8 — 19 days into the episode and 14 days past the window. That left Tier 1 71% below its $3.07B pre-stress level (April 18), a $2.18B drawdown.
Recovery has been gradual and non-monotonic. Tier 1 crossed the 25% recovery milestone ($1.43B) on May 19, 11 days from the trough, but had retraced to $1.39B (23% recovered) by June 17. The 50%, 90%, and 100% recovery milestones remain outstanding. Mean daily Tier 1 refill from the trough through June 17 is $12.6M.
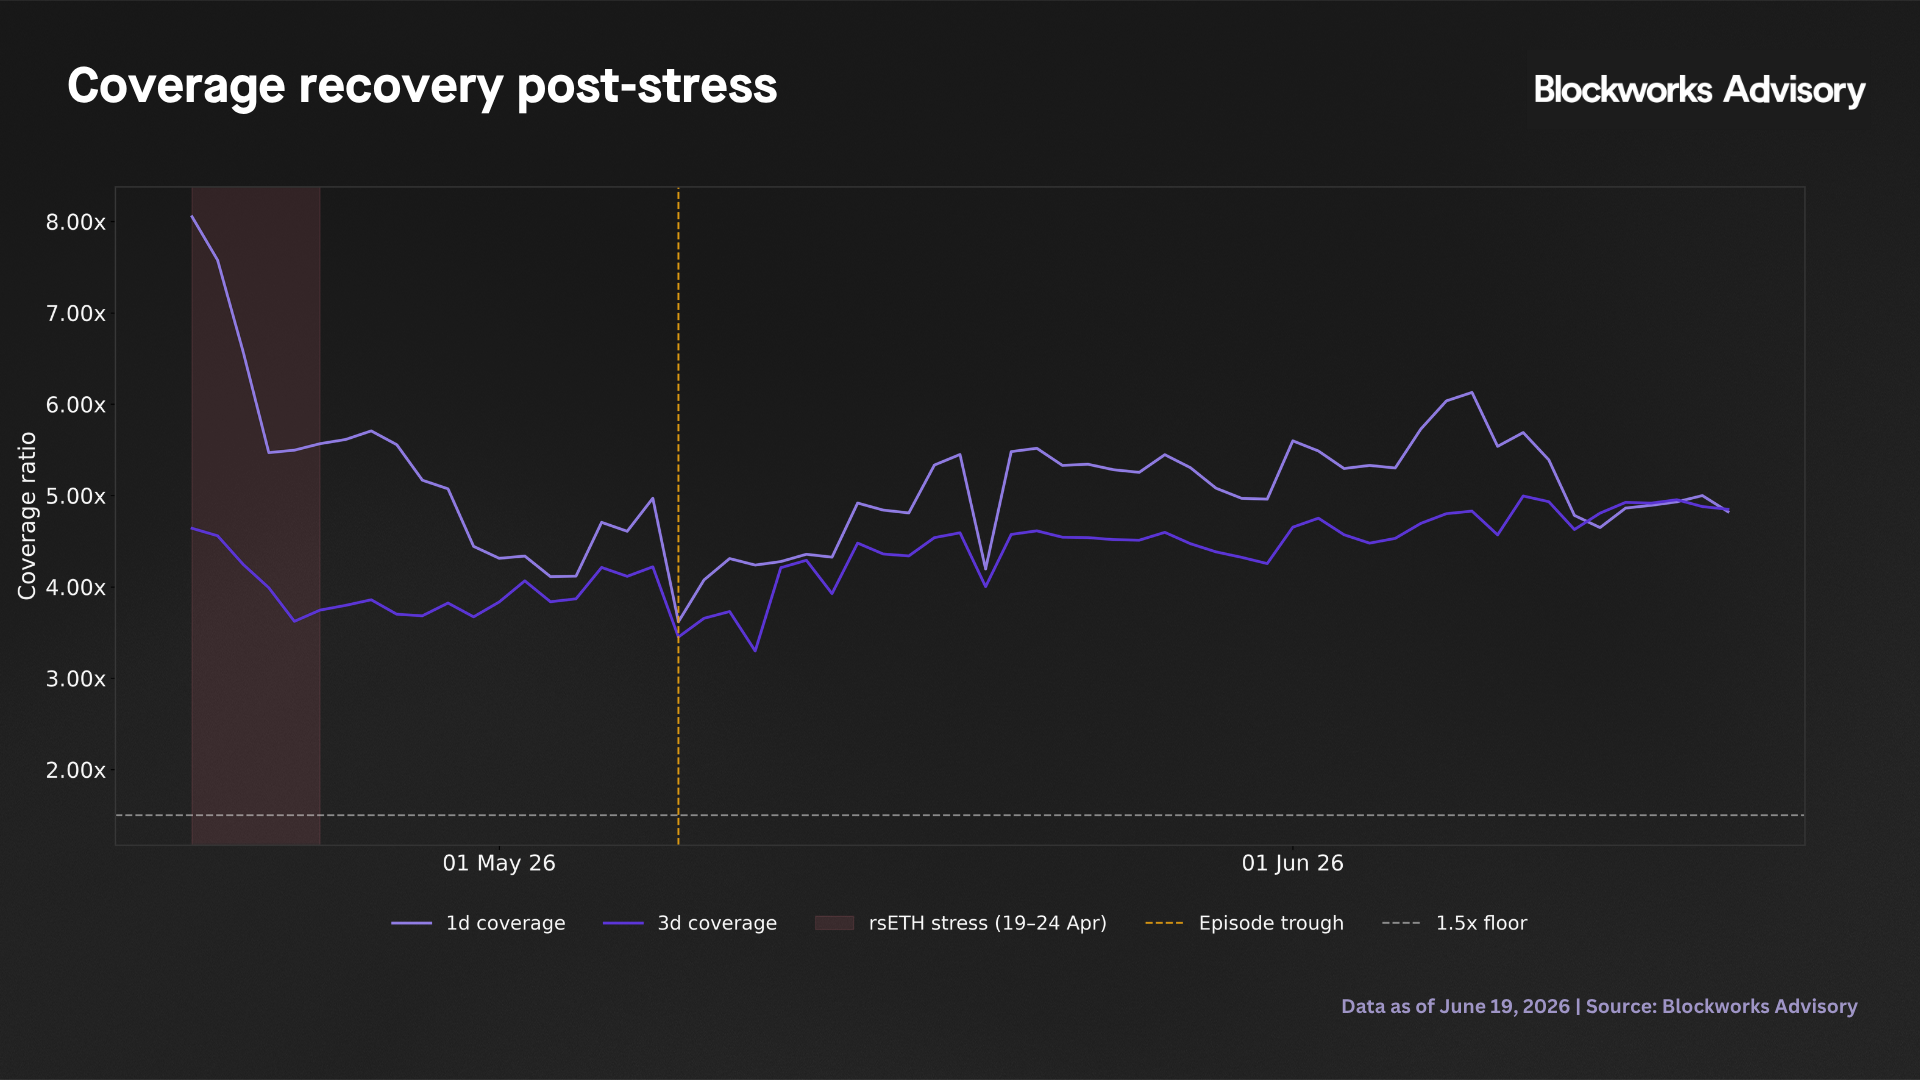
Coverage has remained within a healthy range throughout the recovery window. One-day coverage at the 30-day post stress checkpoint (May 25) was 5.28x; at June 17, it was 5.00x. Three-day coverage moved from 4.52x to 4.88x over the same interval. The policy floor was not approached during the recovery period.
Tier 1 recovery attribution
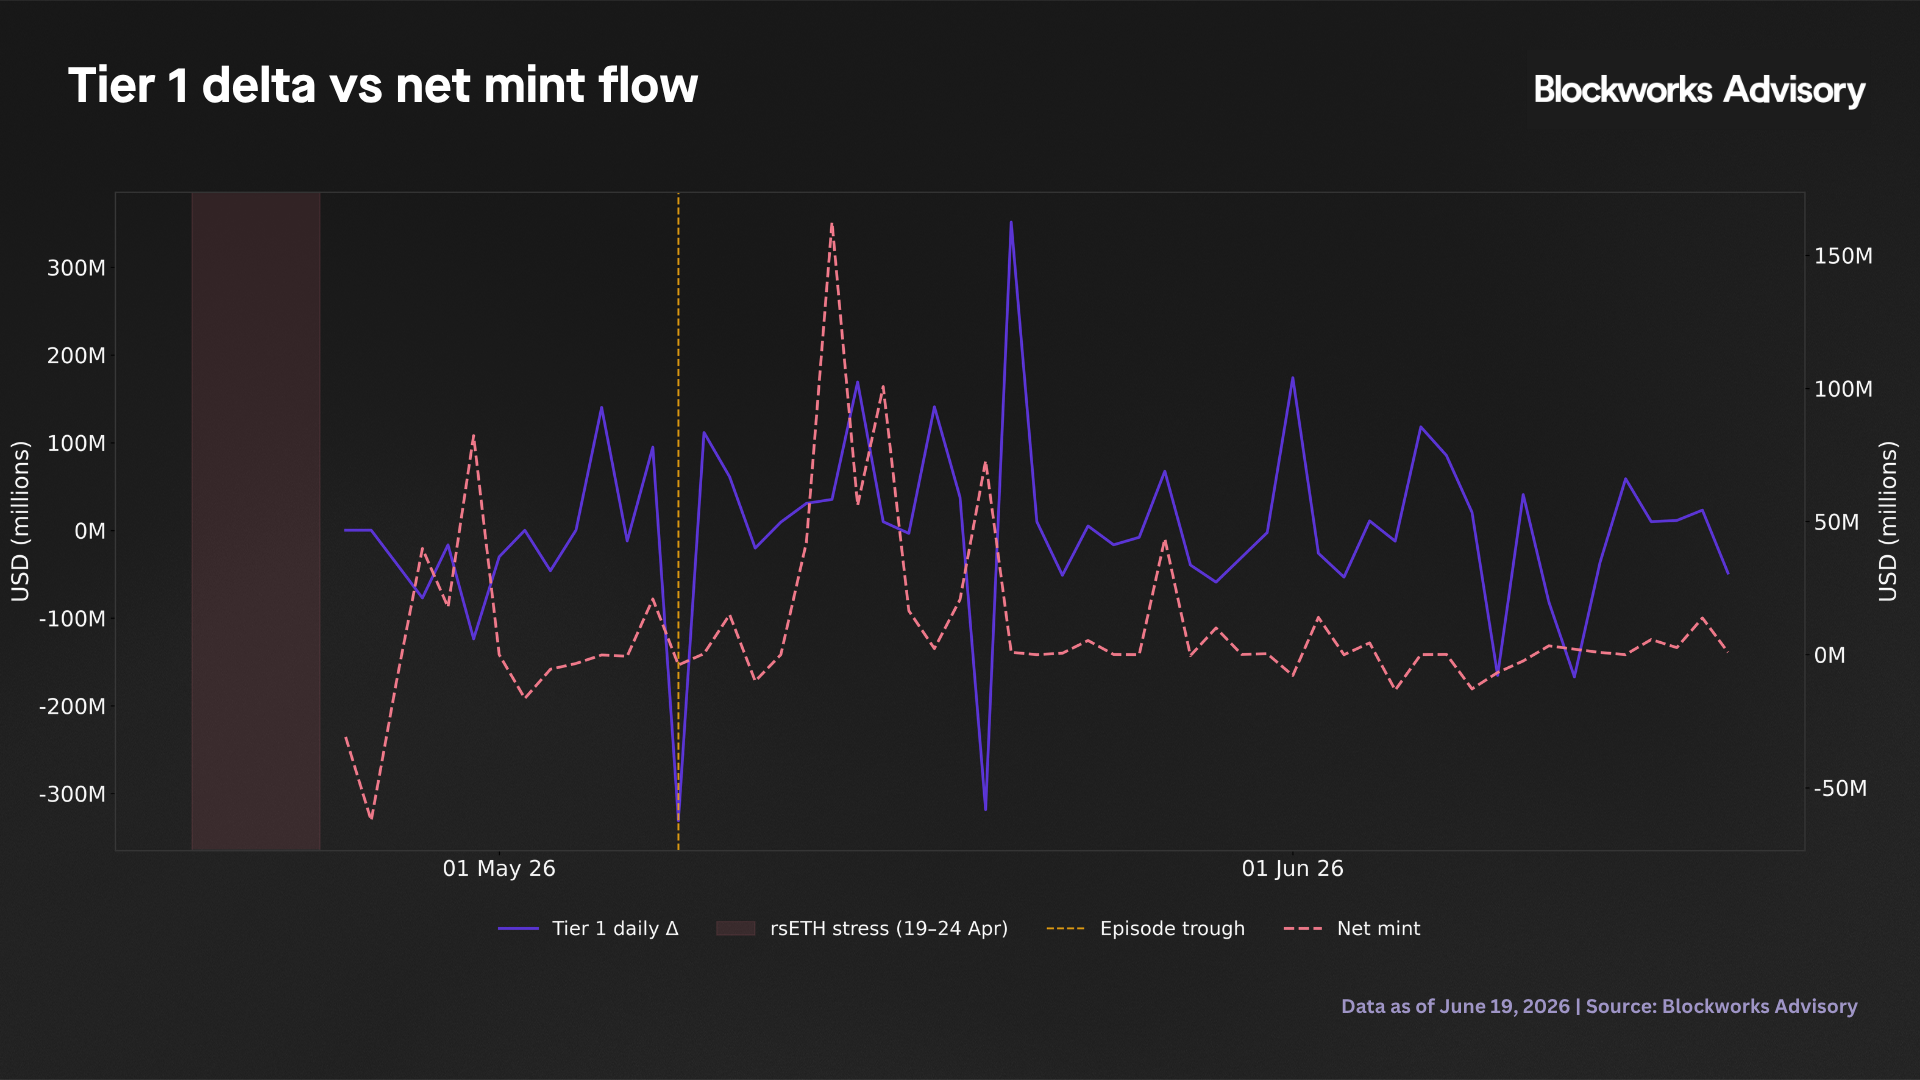
Tier 1 net recovery from the trough through June 17 is $504M, driven by a combination of net minting inflows and gradual lending book recomposition. The precise attribution between sources is not resolvable from tier balance data alone.
RWA sleeve: compositional context for recovery
The most consequential context for interpreting the post-trough Tier 1 trajectory is the addition of tokenized real-world assets to system backing beginning June 10.
On June 10, Ethena introduced JAAA (the Janus Henderson AAA CLO ETF) followed by STAC on June 13. As of June 17, the combined RWA position in Tier 2 totals $500M. Under the cooldown framework, these assets reside in Tier 2 since they carry a two-day redemption horizon, count toward three-day coverage, and do not contribute to the one-day Tier 1 floor or the Tier 1 daily cap.
This compositional structure affects the interpretation of Tier 1 recovery data. Tier 1 reached a post-trough peak of $1.69B on June 8 and has since moderated. Backing capital added from June 10 onward entered the system via the RWA sleeve in Tier 2; it did not flow into the Tier 1 liquid bucket. This routing is one factor explaining why Tier 1 has not sustained its June 8 level. Monitoring Tier 1 in isolation understates the post-stress rebuild once the RWA position is active.
Combined Tier 1 plus Tier 2 refill from the trough totals $1.15B, more than double the $504M on Tier 1 alone. The RWA sleeve has contributed a mean 0.67x of three-day coverage uplift since June 10; as of June 17, three-day coverage stood at 4.88x. Once RWA is operational, the metrics that matter are combined Tier 1 plus Tier 2 and three-day coverage — Tier 1 in isolation is an incomplete measure of system backing adequacy.
Three-month performance assessment
The framework absorbed a genuine correlated stress event without the Tier 1 balance breaching the required buffer floor. Over six days, $1.97B of cumulative redemptions moved through the system. Minimum headroom above the required buffer was $1.08B and minimum one-day coverage was 5.47x. Every redemption day satisfied the Tier 1 daily cap implied by the framework. The operational decision to maintain a one-day cooldown was consistent with the data at each point during the episode.
The queue overlay identified elevated model pressure on five of the six days, beginning April 20 when the consecutive escalation condition was first satisfied. The operational policy treated the overlay as a monitoring signal. That treatment is consistent with the framework's design where coverage is the governing metric and coverage remained within the SAFE range throughout.
The post-stress recovery constitutes a distinct analytical period. Tier 1 continued declining for 14 days after the formal stress window closed, troughed at 71% below the pre-stress reference, and has recovered 23% of the pre-stress drawdown as of June 17. The recovery pace reflects gradual recomposition of the backing portfolio as lending positions unwind and new capital enters the system. The introduction of the RWA sleeve ($500M of JAAA and STAC in Tier 2 from mid-June) lifted mean three-day coverage by 0.67x without affecting the Tier 1 headline figure. Both single-tier and multi-tier coverage metrics are now required for an accurate assessment of system backing adequacy.
Back to Insights
Newsletter
The Breakdown
Decoding crypto and the markets. Daily, with Byron Gilliam.
Blockworks Research
Unlock crypto's most powerful research platform.
Our research packs a punch and gives you actionable takeaways for each topic.
Blockworks Inc.
133 W 19th St., New York, NY 10011
Blockworks Network