Insights / Advisory Analysis
Ethena: sUSDe Dynamic Cooldown Framework
This analysis develops a dynamic cooldown framework that adjusts sUSDe unstaking periods based on real time liquid backing adequacy.
By Blockworks Advisory ·
1 Framework architecture
Liquidity tier classification
The framework categorizes liquid backing into three settlement speed tiers:
Tier 1 (1-day settlement)
- Blue chip stablecoins (USDC, USDT, PYUSD): currently $1,996M (50% of liquid backing)
- Mint/redeem contract holdings: Included in above
- Ethena native stable (USDtb): Included in above
- Current allocation: 50% (target 40-55% for consistent < 3-day cooldowns)
Tier 2 (2-day settlement)
- Yield bearing stables (sDAI, sUSDS): currently $1,089M (27%)
- Withdrawable lending positions: Weighted by protocol liquidity constraints
- Methodology: Per protocol allocation = min(supplied balance, withdrawable liquidity)
Tier 3 (5-day settlement)
- Utilization constrained lending positions: currently $908M (23%)
- Rationale: Requires market utilization decrease to free capital
Current state (February 4, 2026):
Based on the cooldown analysis, total usable liquid backing is $4.0B (61% of $6.5B USDe supply) with
- Tier 1 alone ($2.0B) exceeds required buffer ($897M) by 2.2×
- Recommended cooldown: 1 day
- Safety status: green (4.42× coverage >> 1.5× target)
2 Historical performance analysis (752 Days)
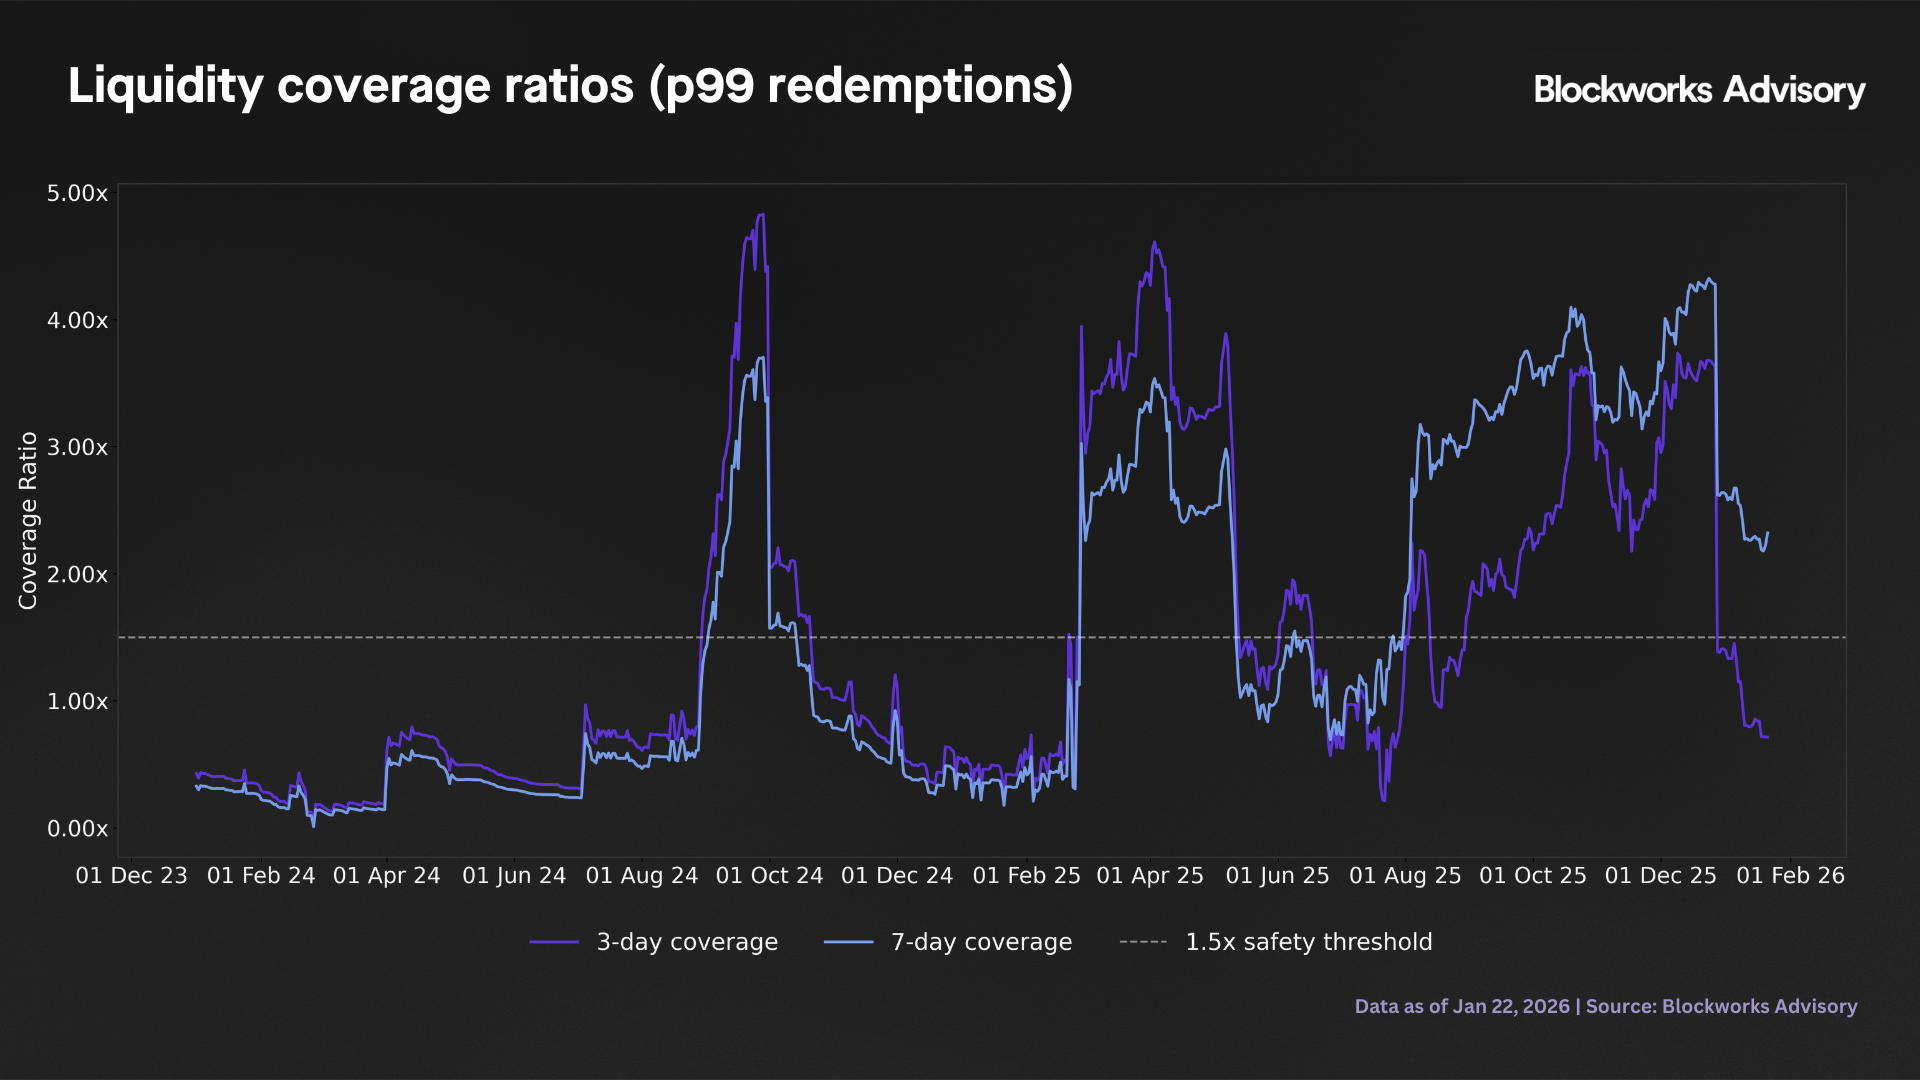
Coverage distribution - statistical summary (1.5× target):
Minimum: 0.00× (complete depletion during early growth phase)
Median: 1.33× (11% below safety threshold)
P95: 4.54× (abundant liquidity periods)
Maximum: 4.89× (current near peak state)
Interpretation: Median coverage below 1.5× target indicates 50% of historical observations operated in suboptimal liquidity regime.
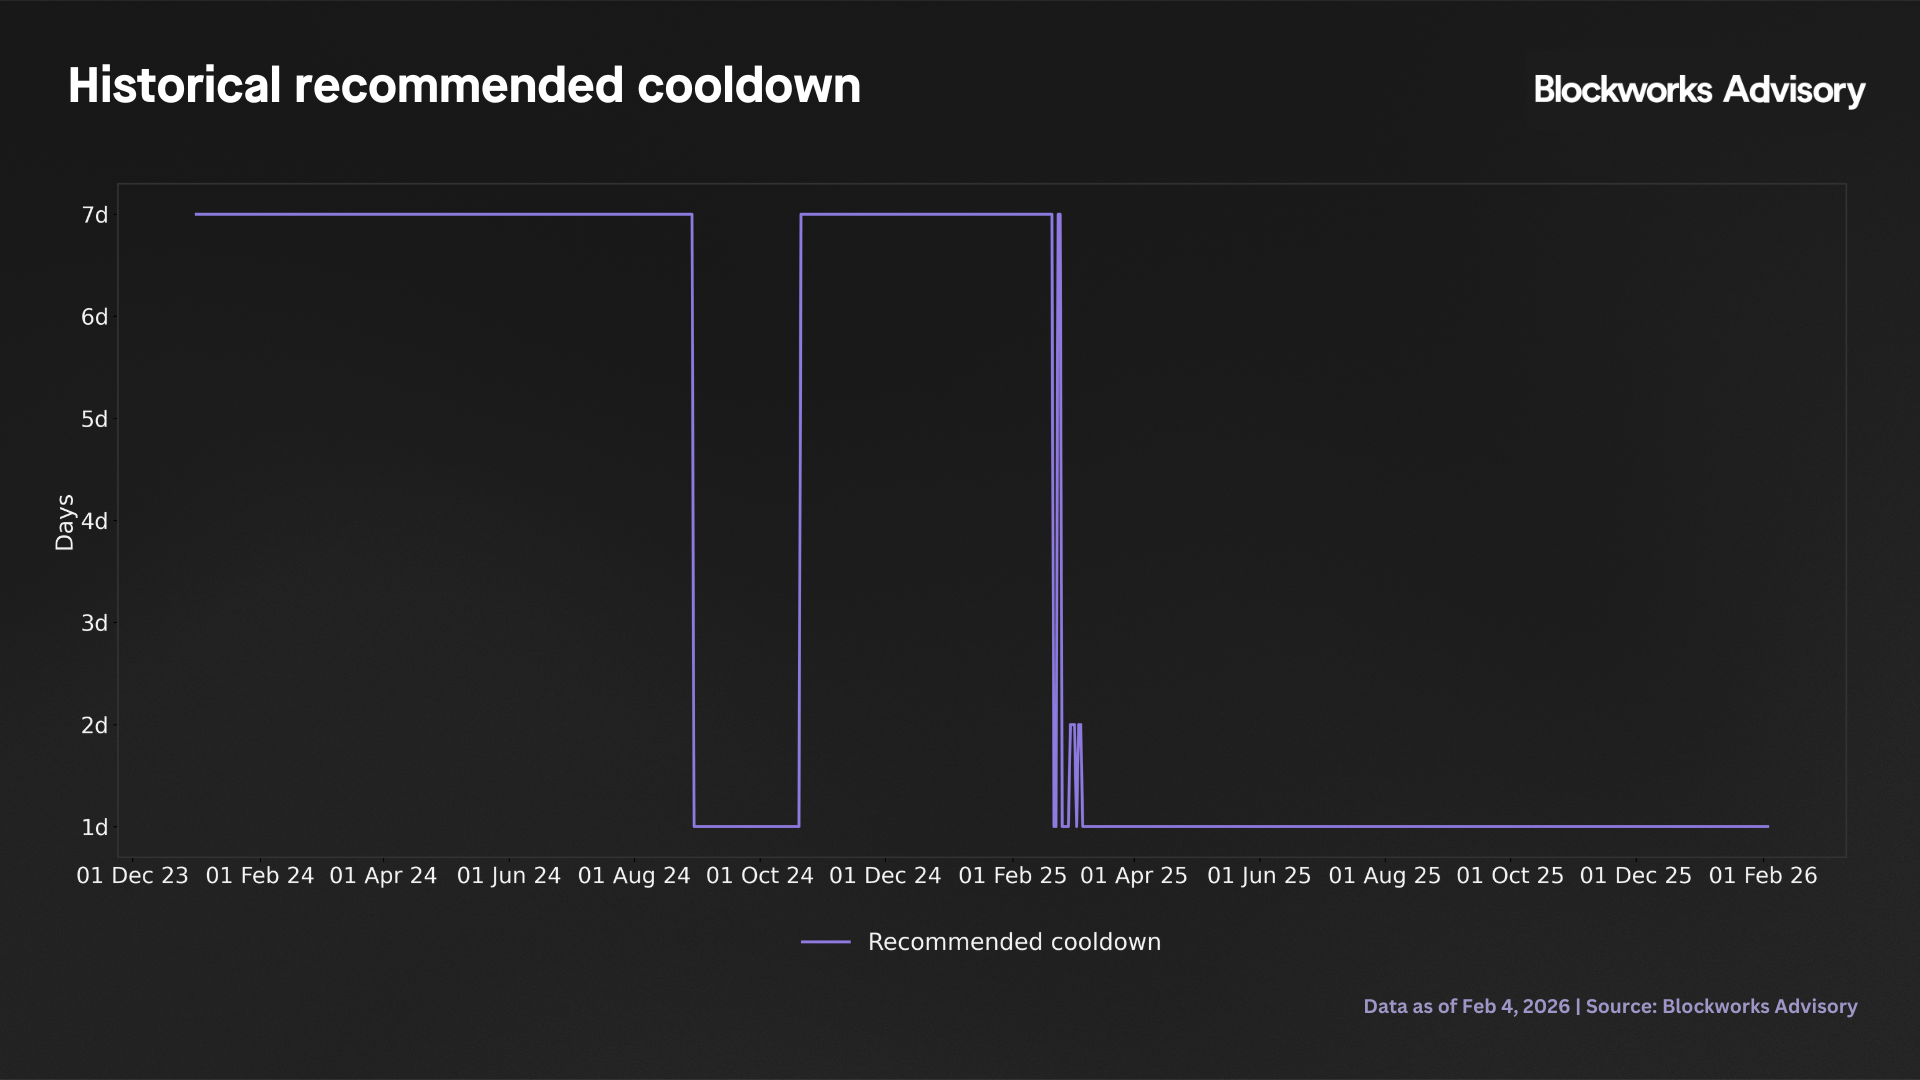
Cooldown requirement distribution - bimodal regime structure:
1-day cooldown: 51.4% of days (high liquidity regime)
2-day cooldown: 0.7% of days (rare transition state)
7-day cooldown: 48.0% of days (low liquidity regime)
Average cooldown: 3.88 days
Regime transitions: 9 events over 752 days (1.2% regime change frequency)
Critical observation: The system exhibits discrete operational modes. The near absence of intermediate cooldowns (2-5 days at 0.7%) reveals binary regime dynamics:
- High liquidity regime (Regime A): Tier 1 >50% of liquid backing, coverage >2.0×, supports 1-day redemptions
- Low liquidity regime (Regime B): Tier 1 <35% of liquid backing, coverage <1.5×, requires 7-day cooldowns
Regime transition triggers:
- A → B transitions: Rapid supply growth (+20% in 30 days) without proportional Tier 1 additions, or backing rebalancing toward yield generating Tier 3 assets
- B → A transitions: Supply contraction, defensive Tier 1 accumulation, or external liquidity infusions
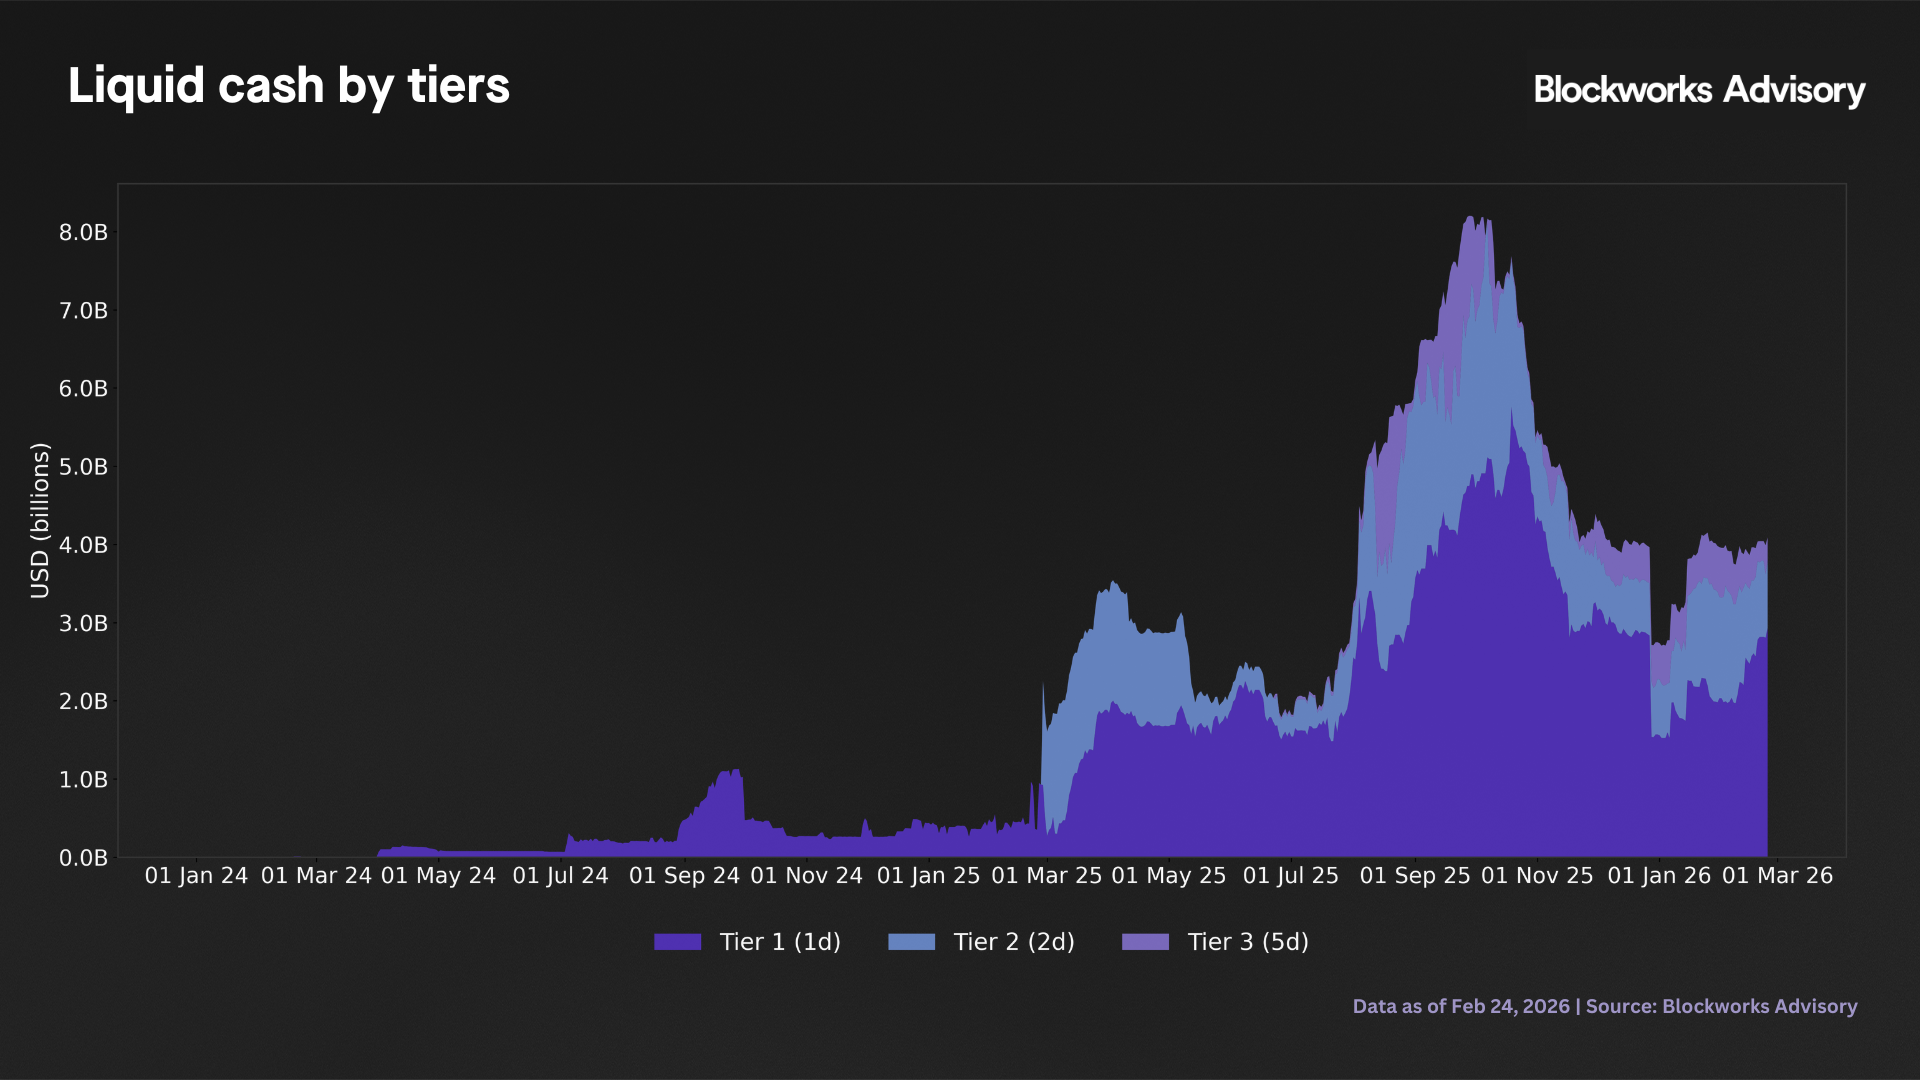
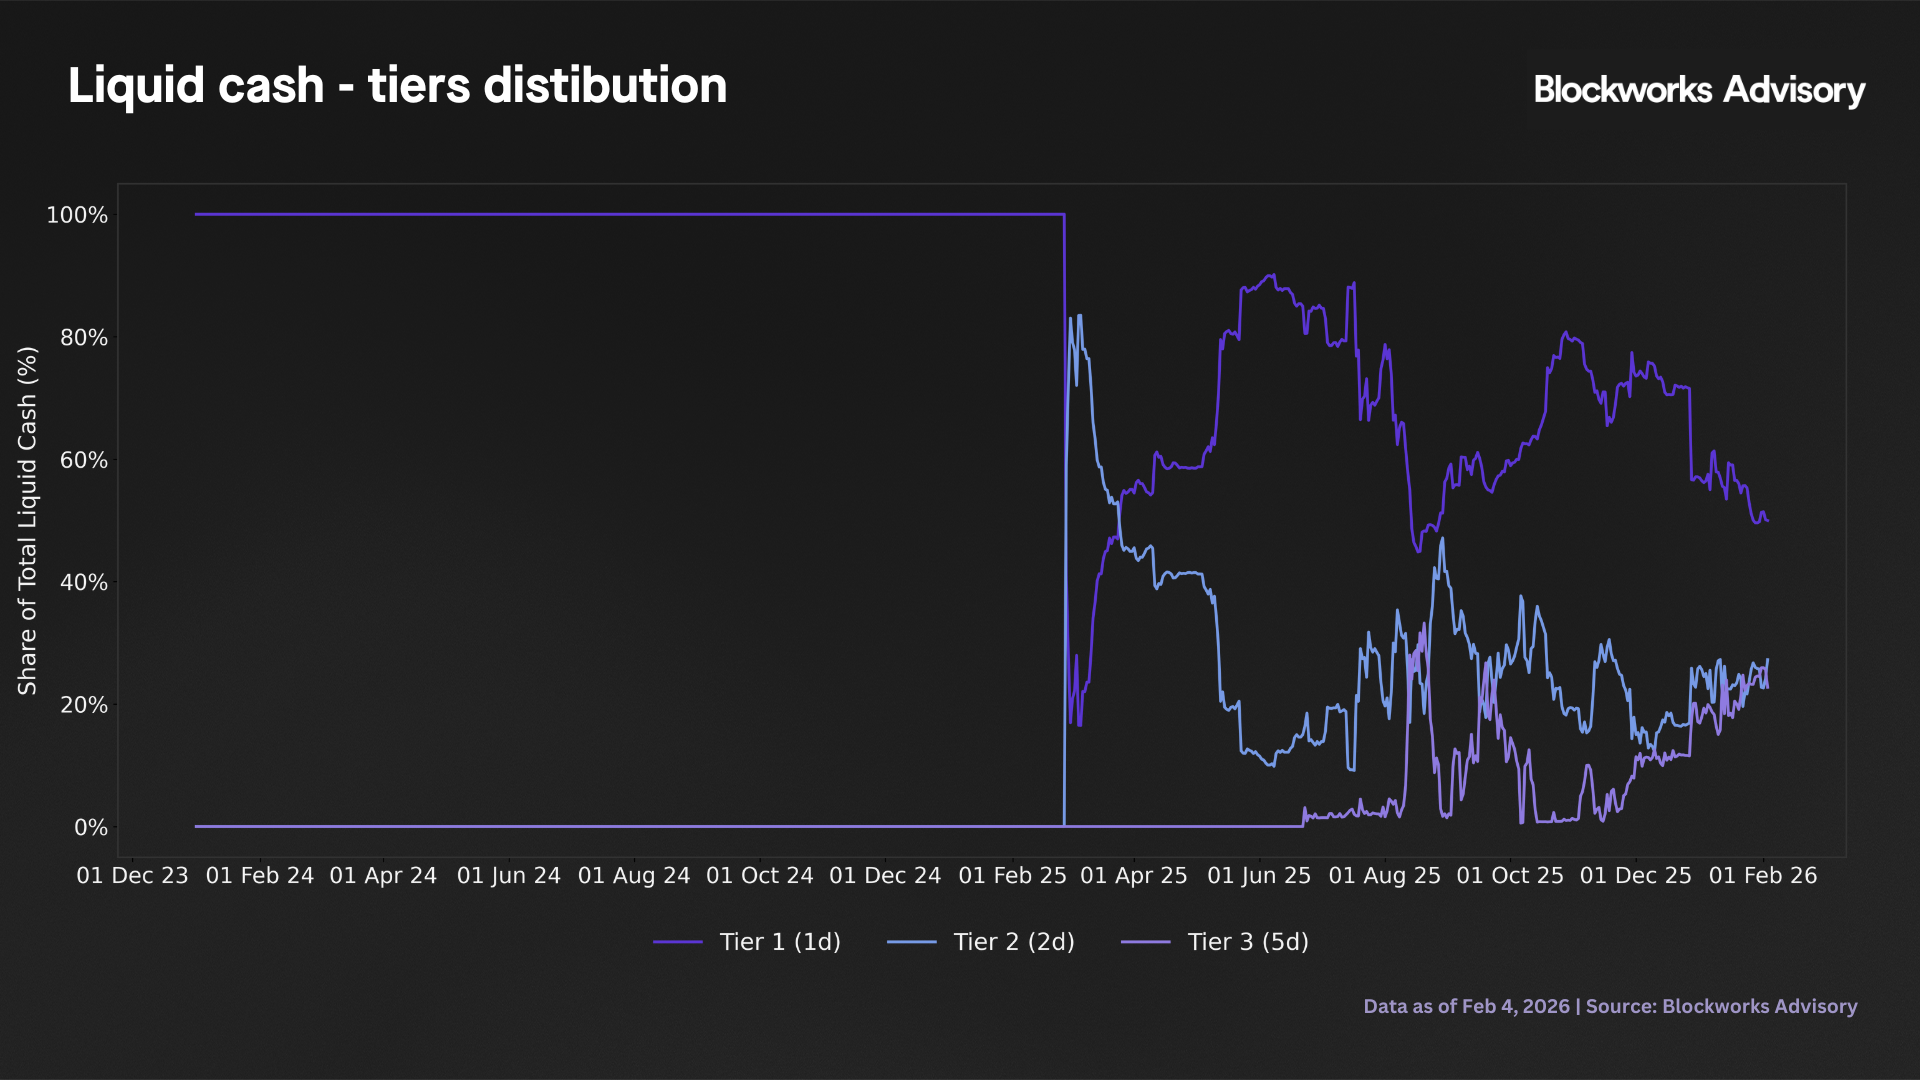
Liquidity evolution patterns - historical tier composition dynamics:
Phase 1 (Jan 2024 - Feb 2025): Emerging operations, Tier 1 dominated (100%), backing ranged from $3.6M to $1.1B, coverage highly volatile especially during rapid scaling period (July-September 2024 saw growth from $70M to $1.1B), minimal backing complexity with all liquid assets in blue-chip stablecoins.
Phase 2 (Feb 2025 - Jun 2025): Framework expansion, Tier 2 introduced on February 27, 2025 at $1.33B (immediate diversification), Tier 1 share collapsed from 100% to volatile 20-80% range as backing rebalanced toward yield generating assets, total liquid backing scaled from $2B to $4B, Tier 1 absolute amounts remained $270M-$2.0B but represented diminished percentage of total (period of framework operationalization).
Phase 3 (Jun 2025 - Feb 2026): Full three tier framework operational, Tier 3 introduced on June 23, 2025, liquid backing surged to peak $8B (October 2025) driven by massive expansion, then contracted 50% to current $4.0B, Tier 1 maintained at $2.0B representing 50% of liquid backing (defensive stance during contraction period), current coverage 4.42× represents local maximum
Implication: Current favorable coverage (4.42×) reflects recent supply contraction combined with maintaining Tier 1 at 50% of liquid backing, not structural improvement in supply liquidity dynamics. Renewed growth will likely revert to Regime B unless Tier 1 grows proportionally.
3 Forecast scenarios (12 month horizon)
Econometric framework:
- Vector Autoregression (VAR): 7-day lag structure modeling Tier 1/2/3 interdependencies and supply dynamics
- Regime-Switching: Endogenous identification of normal versus stress states based on coverage thresholds
- Monte Carlo Simulation: 1,000 runs per scenario, student t innovations for fat tail representation
- Initialization: From historical median state to avoid optimistic bias
Forecast validation: Updated scenarios show 5-10% of days requiring 7-day cooldowns (vs historical 48%), indicating the model assumes moderate liquidity regime improvement but acknowledges persistent constraints.
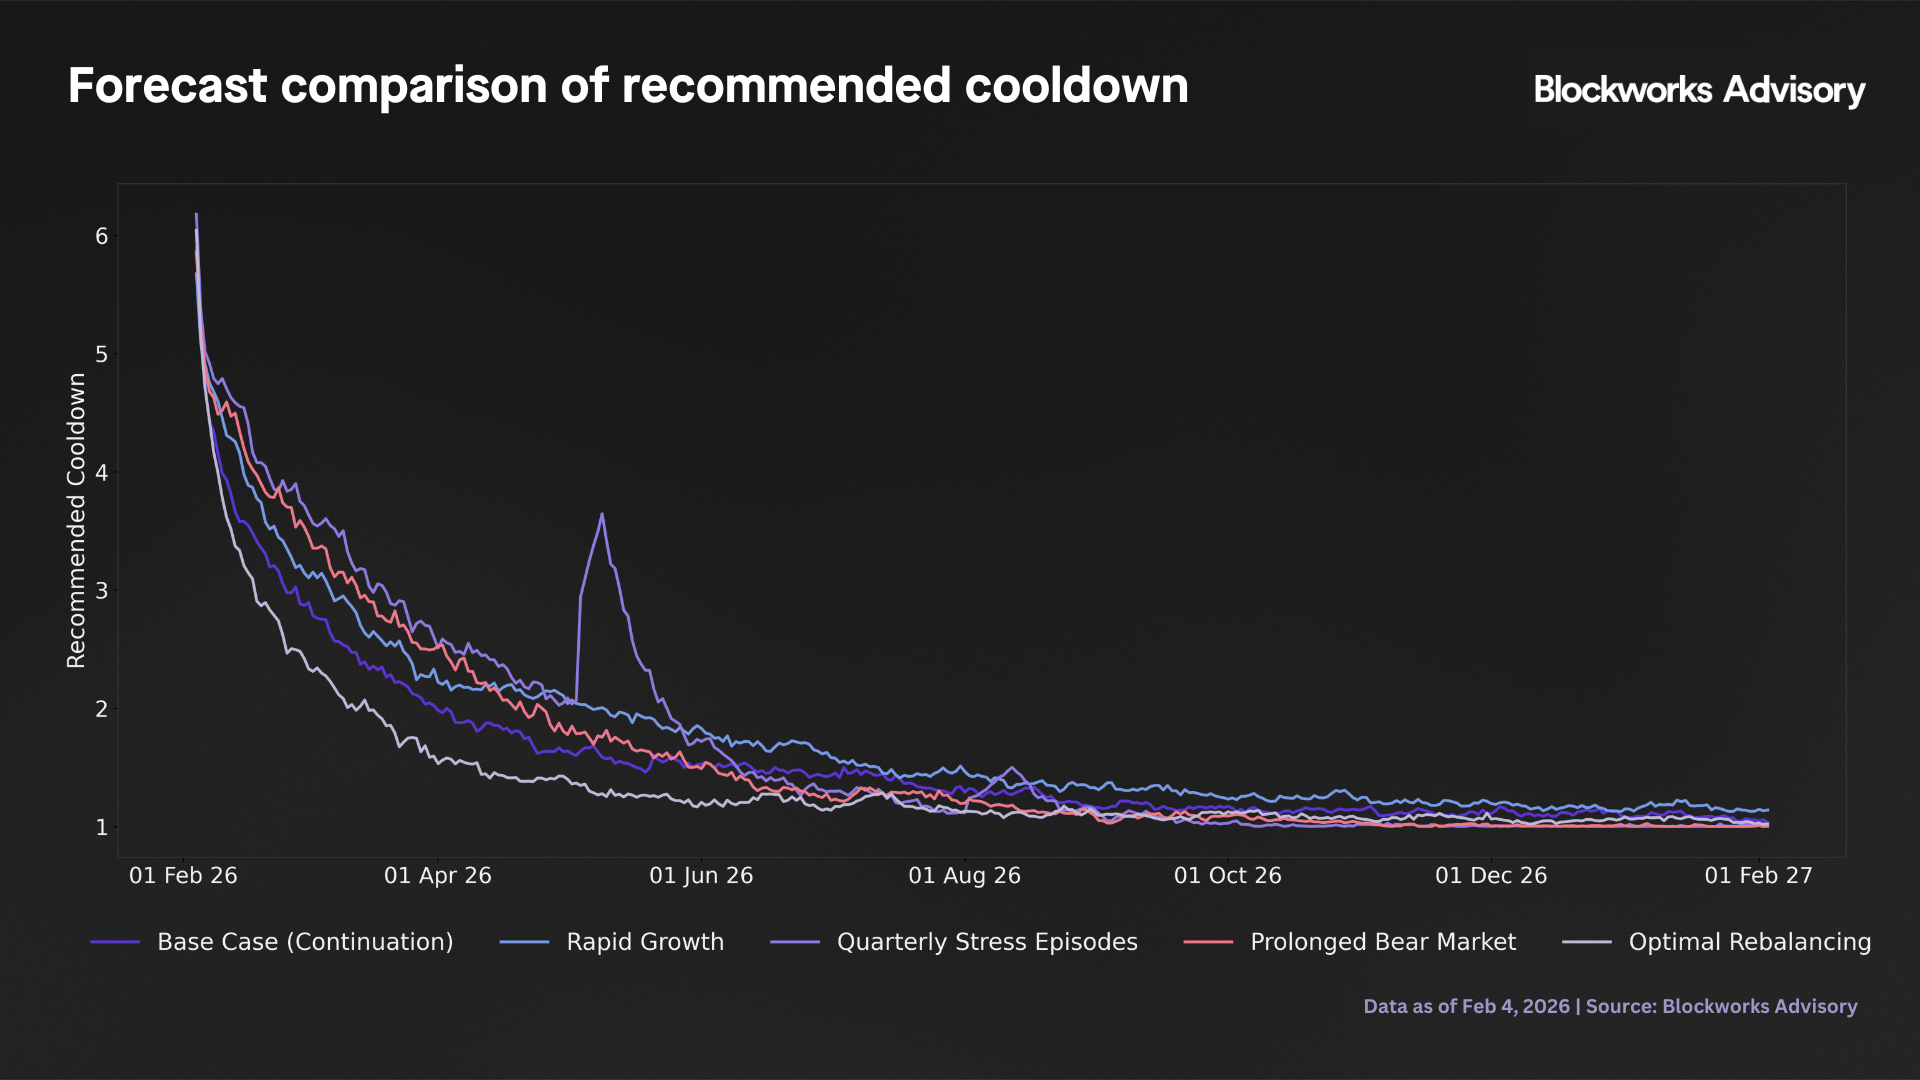
| Scenario | Avg Cooldown | % Days ≤3d | % Days 7d | Avg Coverage | P5 Coverage | Risk Assessment |
| Base Case | 1.17 days | 98.4% | 0.5% | 5.31× | 1.72× | Low risk, assumes moderate supply growth (5% quarterly) and stable Tier 1 allocation (50%) |
| Rapid Growth | 1.32 days | 97.0% | 0.8% | 5.02× | 1.57× | Moderate risk, 15% quarterly growth strains liquidity, P5 coverage approaches safety threshold |
| Stress Episodes | 1.35 days | 96.2% | 2.2% | 17.59× | 1.44× | Elevated risk, quarterly shocks cause periodic compressions, high volatility (P95: 56.9×) |
| Bear Market | 1.26 days | 96.4% | 0.8% | 11.35× | 1.46× | Low to moderate risk, supply contraction reduces redemption pressure, coverage inflates |
| Optimal Rebalancing | 1.12 days | 98.6% | 0.5% | 5.71× | 1.88× | Lowest risk, Tier 1 increased to 55%, supports consistent <2-day cooldowns |
Scenario summary
- All scenarios forecast dramatic improvement over historical 48% at 7-day cooldowns: Even rapid growth shows only 0.8% at maximum cooldown vs 48% historically. This optimism reflects the assumption that recent Tier 1 strengthening (50% vs historical 35% average) persists.
- P5 coverage (5th percentile) is a critical metric: Represents worst case liquidity stress. Rapid growth and stress scenarios show P5 near 1.5× threshold, indicating 5% tail probability of coverage inadequacy requiring emergency measures.
- Optimal rebalancing scenario shows path to consistent short cooldowns: By maintaining Tier 1 at 55% (vs current 50%), protocol achieves 98.6% of days ≤3-day cooldowns with P5 coverage 1.88× (26% safety margin).
- Stress episodes scenario reveals vulnerability to exogenous shocks: Despite average coverage 17.59×, episodic events compress coverage to 1.44× (P5), demonstrating that high average coverage does not eliminate tail risk.
Model assumptions requiring monitoring:
- Initialization optimism: Forecasts start from the median level liquidity which is based on Tier 1 allocation. If Tier 1 erodes due to yield seeking rebalancing, outcomes will underperform projections.
- Behavioral stationarity: Assumes redemption patterns follow historical P99 benchmarks (9.2% for 3-day window). Black swan events or protocol specific crises could generate larger redemption waves.
- Scenario parameter effectiveness: Rapid growth scenario should show more stress than base case, but coverage differential is modest (5.02× vs 5.31×). This suggests VAR dynamics dominate scenario inputs, potentially understating growth driven risks.
4 Conclusion
The dynamic cooldown framework represents a theoretically sound, operationally feasible approach to balancing user experience (fast redemptions) with protocol safety (liquidity adequacy). Current system status is highly favorable (4.42× coverage, 1-day cooldowns), but historical analysis reveals persistent structural tension between supply growth and Tier 1 liquidity accumulation that generates bimodal operational regimes.
Forecast scenarios suggest moderate improvement over historical performance, with 95-99% of days supporting ≤ 3-day cooldowns across all scenarios. However, this optimism relies on maintaining current favorable Tier 1 allocation (50%), which has historically fluctuated between 15-70% and averaged 35%. The protocol must institutionalize minimum Tier 1 policies to prevent reversion to low liquidity regimes that characterized mid-2024 to mid-2025 operations.
Live dashboard integration enables proactive risk management, transforming a reactive system (extend cooldown after coverage falls) into a predictive system (extend cooldown before coverage crisis materializes). Real time monitoring with 1-hour update frequency for critical metrics provides operational teams 24-48 hour advance warning of liquidity stress, sufficient time to execute defensive rebalancing or cooldown adjustments.
Back to Insights
Newsletter
The Breakdown
Decoding crypto and the markets. Daily, with Byron Gilliam.
Blockworks Research
Unlock crypto's most powerful research platform.
Our research packs a punch and gives you actionable takeaways for each topic.
Blockworks Inc.
133 W 19th St., New York, NY 10011
Blockworks Network
Resources & Legal