Insights / Advisory Analysis
Ethena: sUSDe Cooldown Reduction Analysis
This analysis examines whether Ethena’s sUSDe redemption system can safely transition from a 7-day to 3-day or a dynamic cooldown period.
By Blockworks Advisory ·
Background
Ethena’s sUSDe token requires a cooldown period before redemption, currently set at 7 days. This creates friction for users but gives the protocol time to prepare for large redemptions by rebalancing assets or sourcing liquidity. A shorter 3-day cooldown would reduce capital lock up and improve user experience, but it compresses the time window Ethena has to respond to redemption pressure.
The central question this analysis addresses is “Can Ethena’s backing assets support faster redemptions without creating unacceptable risk of liquidity shortfalls?” To answer this question, we analyzed over two years of data covering queue activity, backing composition, secondary market behavior, cross-chain distribution and redemption flows.
1. Queue and outflow dynamics under alternative cooldown regimes
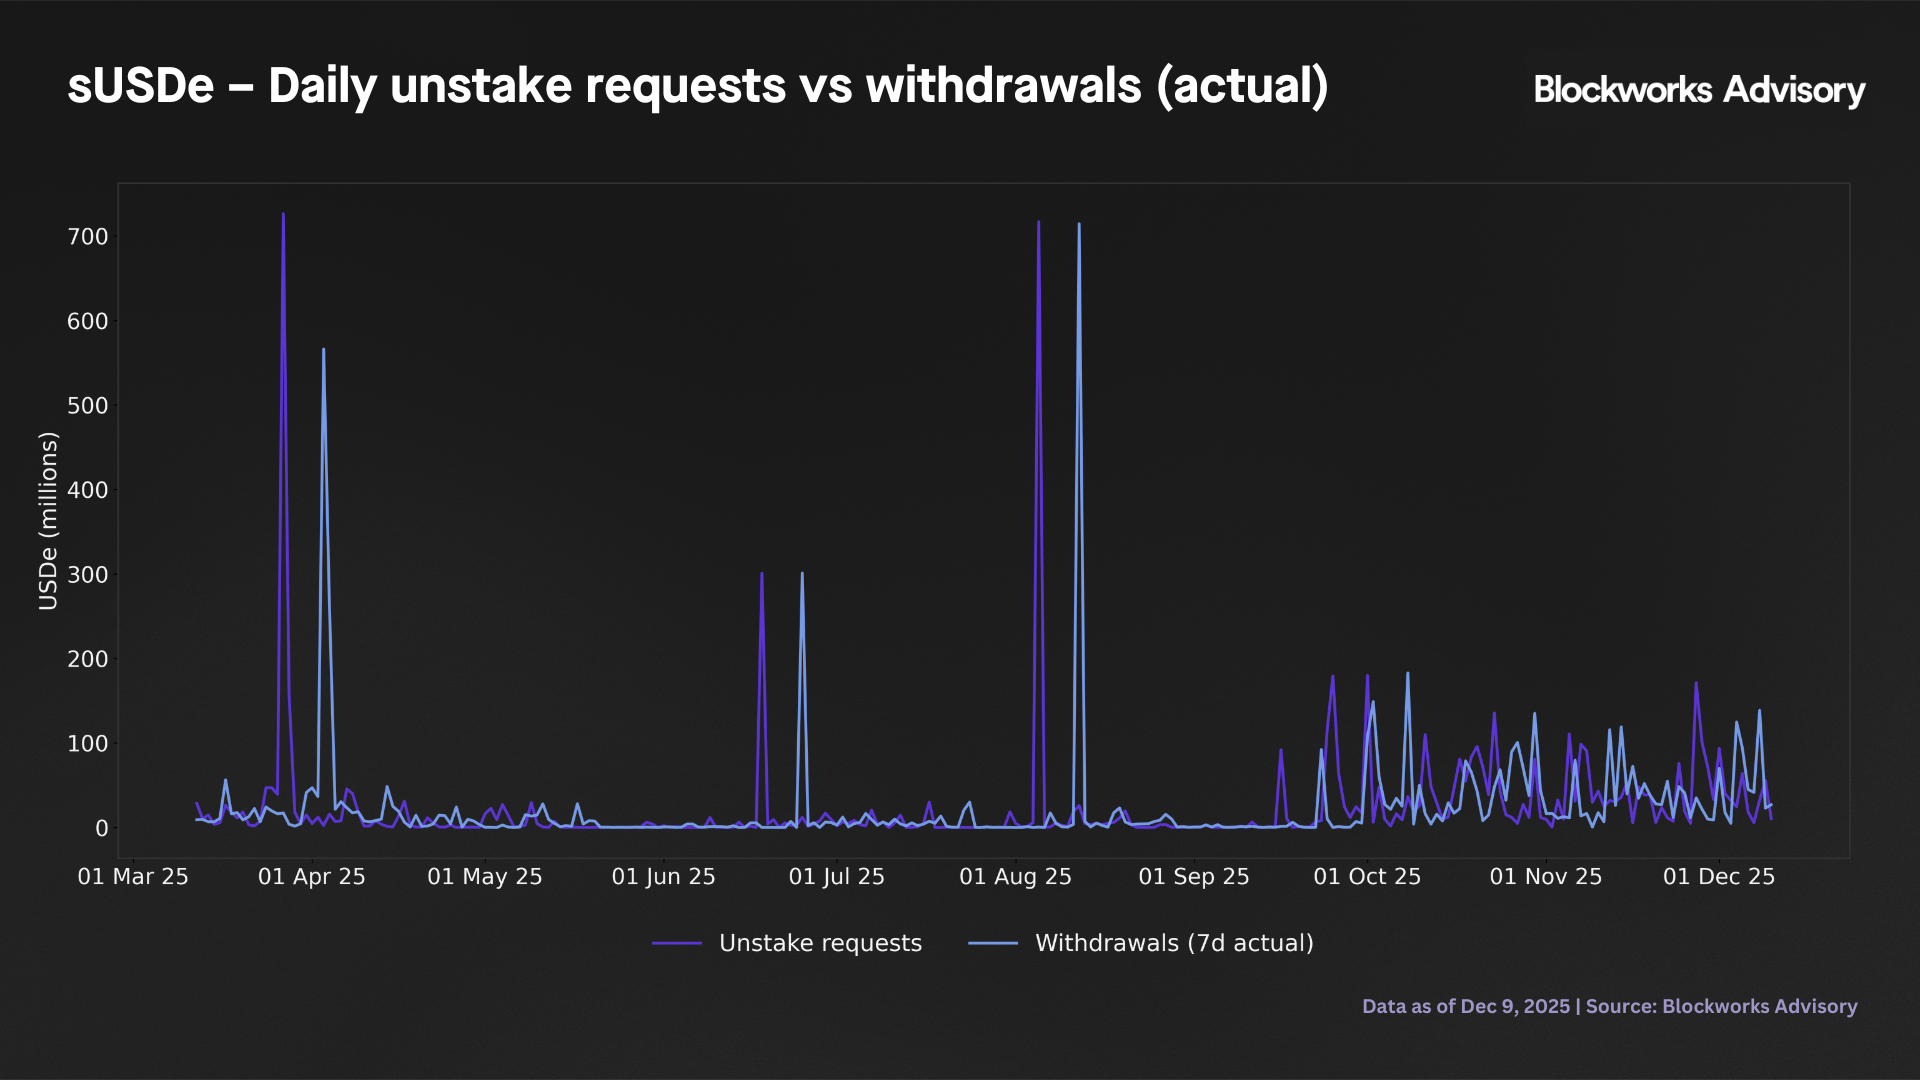
We reconstruct sUSDe unstake and withdrawal dynamics from onchain events. Using the observed 7-day cooldown regime, the distribution of 1-day redemptions is moderately fat tailed but not extreme. The 95th percentile daily outflow is about 55m USDe (2.35% of sUSDe supply), and the 99th percentile rises to 138m USDe (8.10% of supply). The single largest observed redemption day is 714m USDe, corresponding to 28.9% of sUSDe supply. This day is an outlier as most large outflows lie well below this level.
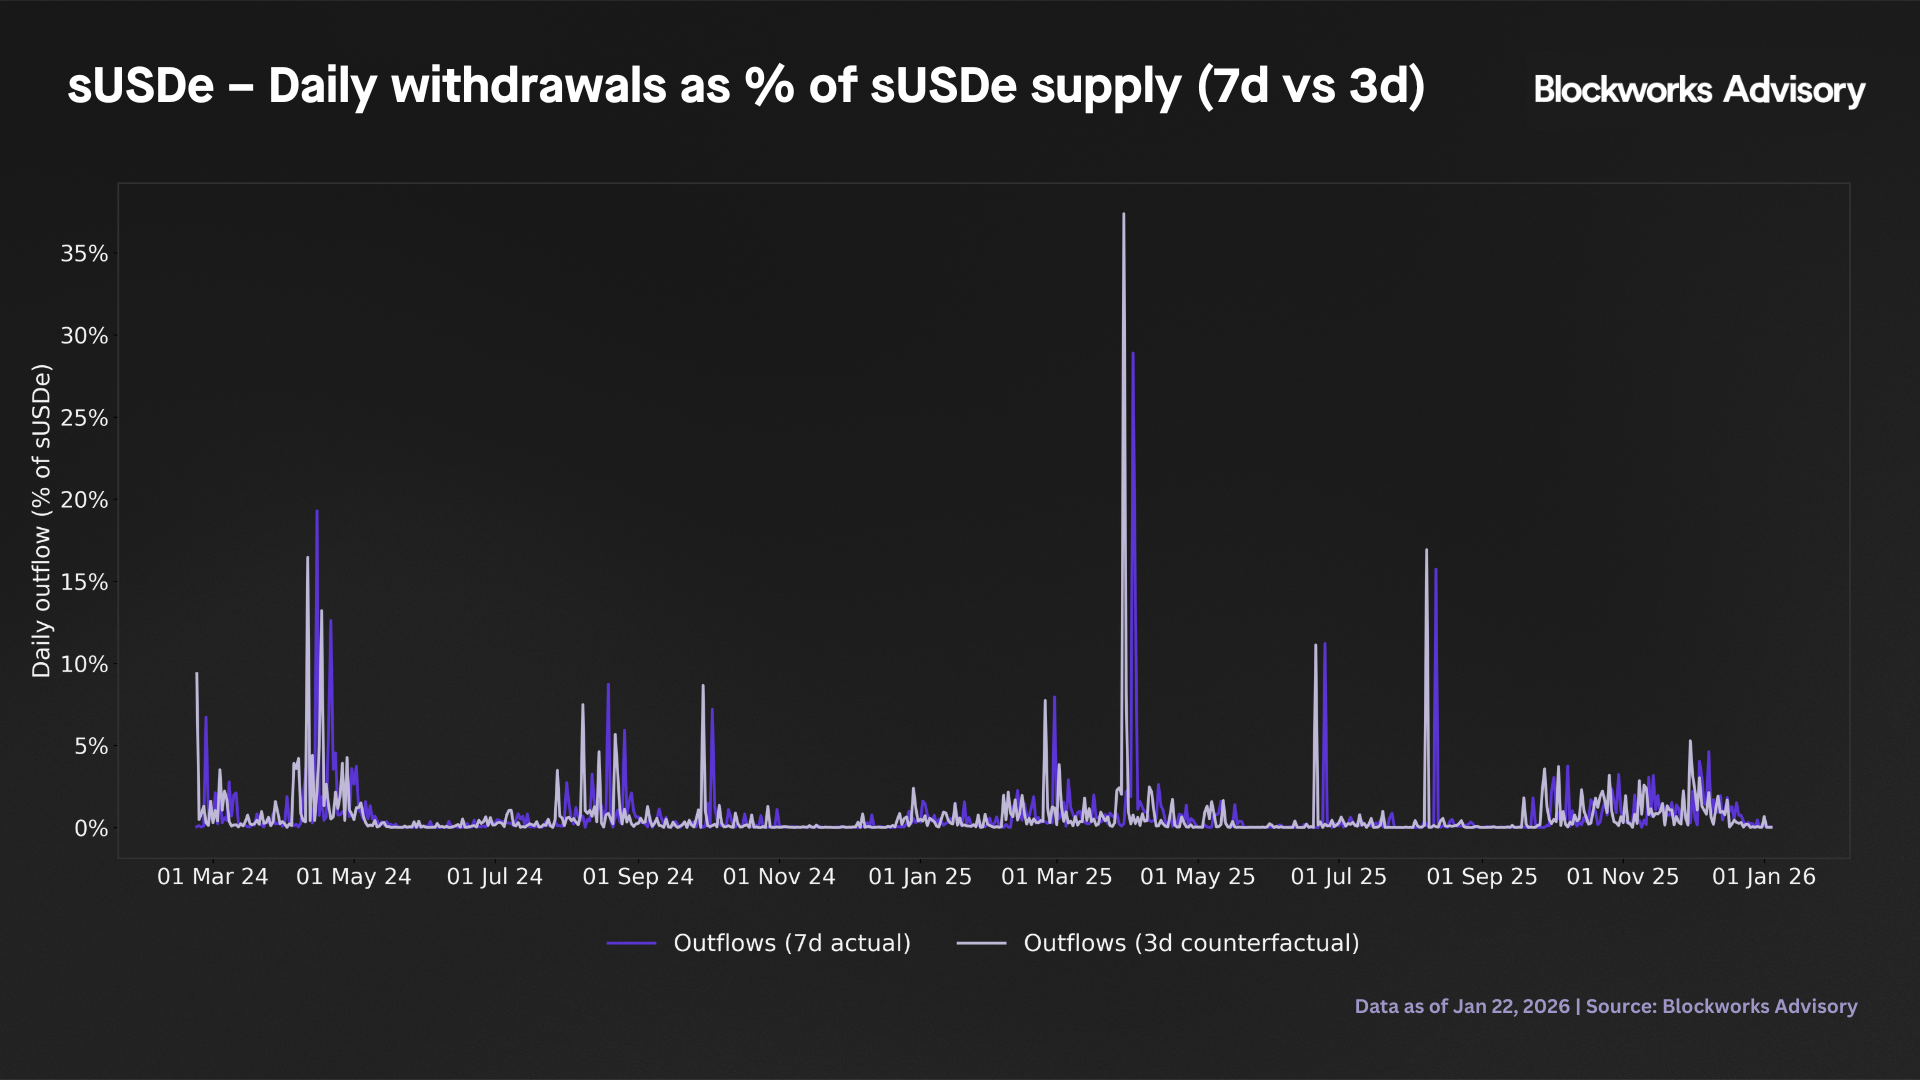
We then impose a counterfactual 3-day deterministic cooldown that preserves the historical path of unstake requests but assumes that every request is withdrawn at the first eligible date (t+3). Under this mechanical shortening of the queue, the tail of the daily outflow distribution becomes slightly fatter rather than milder. The 99th percentile daily outflow rises from 138m USDe (8.10%) under the 7-day regime to 153m USDe (8.23%) under the 3-day regime, while the 95th percentiles remain very similar (55m USDe vs 58m USDe, both 2.4% of supply). In other words, a shorter cooldown concentrates redemptions into fewer days, i.e., increases tail outflow risk. This makes peak redemption days slightly larger with the worst single day increase from 714m to 726m.
Importantly, the counterfactual shows that a shorter cooldown does not guarantee a lower maximum one day outflow. In the simulated 3-day regime, the largest one day redemption is 726m USDe (37.4% of supply), notably above the historical peak of 714m USDe (28.9%). This reflects purely mechanical timing effects since when very large request batches happen to fall three days before a relatively small inflow day, they translate into a larger t+3 spike even though the overall request path is unchanged. From a risk perspective, shortening the cooldown modestly increases both the frequency and magnitude of large redemption days, though the increases are relatively small in percentage terms (p99: +0.13pp, max: +8.5pp as % of supply).
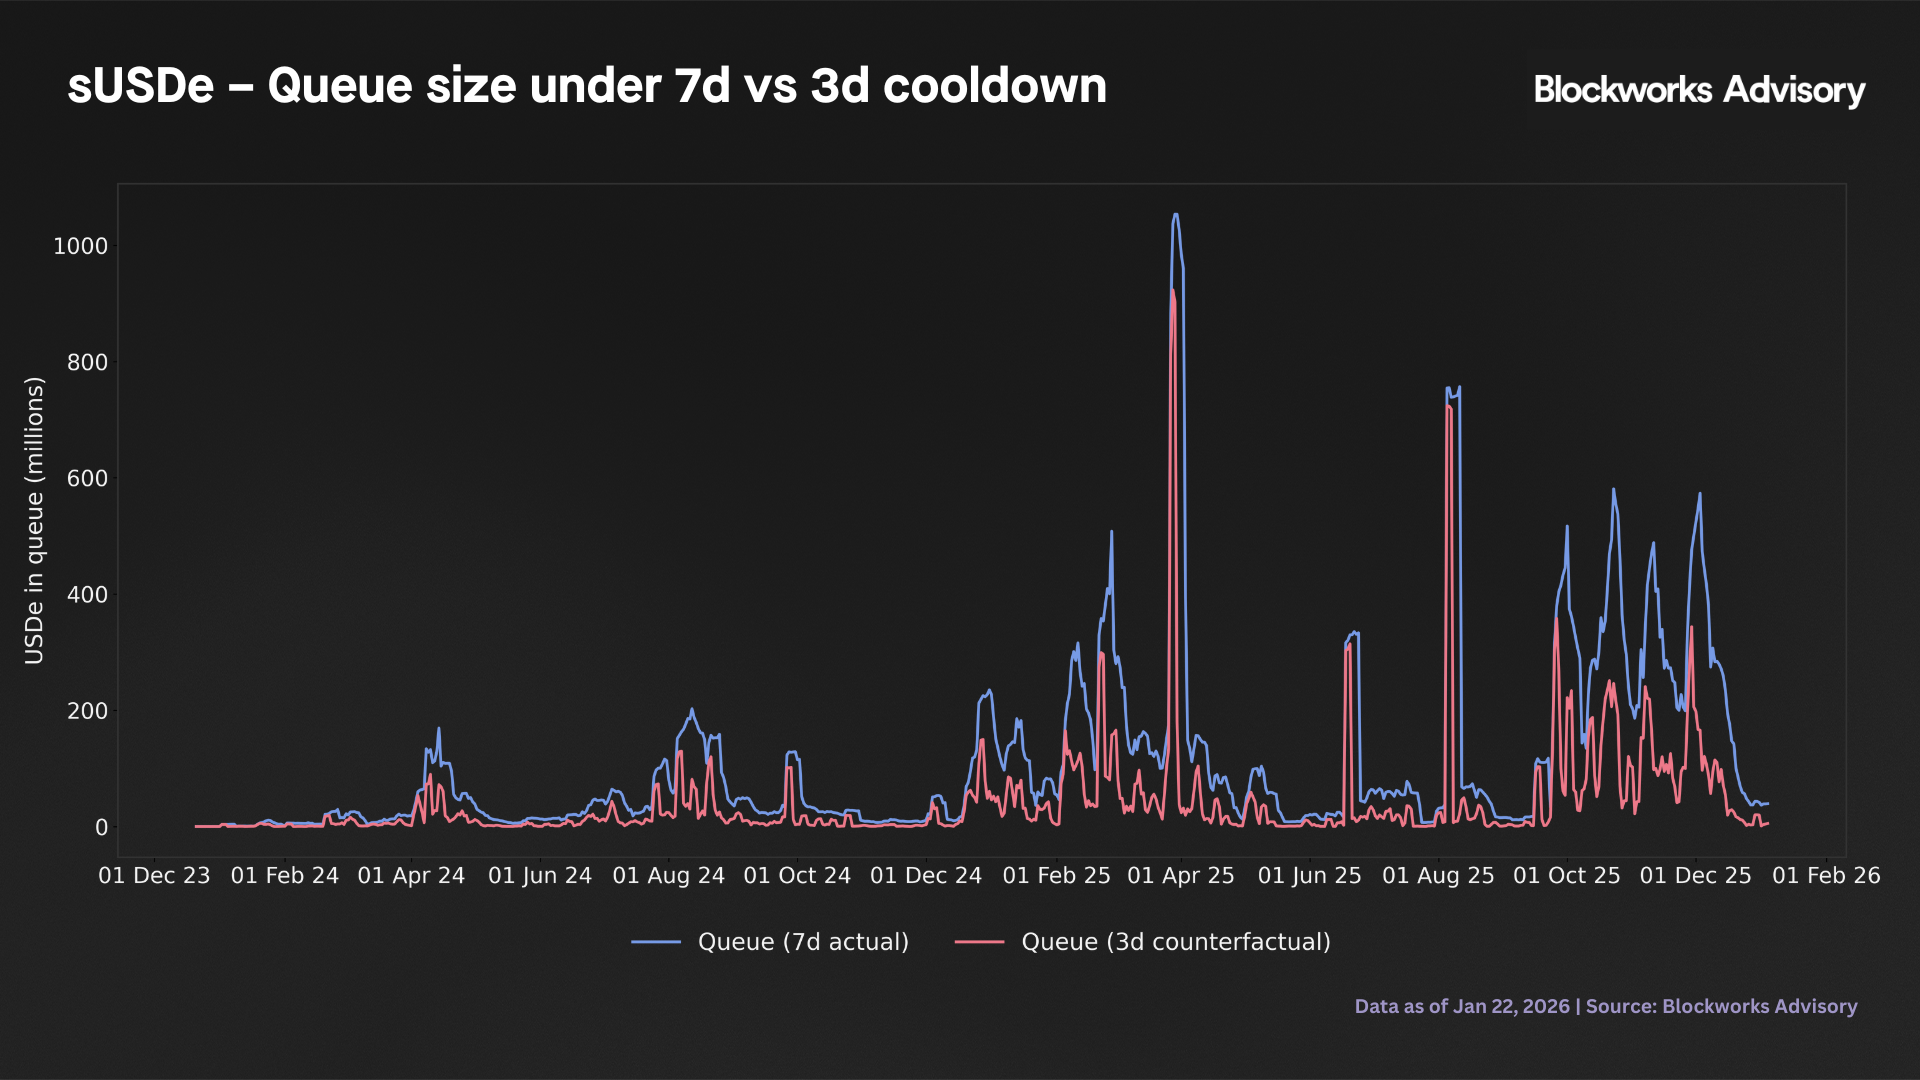
Queue stocks respond more substantially to the shorter regime. The peak outstanding unstake queue is 1,054m USDe under the observed 7-day regime and 923m USDe in the counterfactual 3-day regime, a reduction of 12.4%. This is consistent with intuition as for a given path of requests, a shorter cooldown reduces the average holding period in the queue, leading to meaningfully lower peak queue stocks even though the largest single-day outflows can be higher.
Overall, the results of this step suggest that, conditional on historical behaviour, a 3-day cooldown presents a mixed risk profile. It substantially reduces peak queue stocks (−12.4%), which is operationally beneficial, but modestly increases the tail of daily redemptions (p99 rises from 8.10% to 8.23% of supply) and can amplify maximum one day outflows (from 28.9% to 37.4% of supply) due to mechanical timing effects. Because the counterfactual assumes that all users withdraw at the earliest possible time, these results should be read as a conservative upper bound on short term horizon outflows under a 3-day regime. In practice, behavioural staggering would likely further smooth redemptions and reduce both tail risk and maximum outflows.
2. USDe liquidity, redemption shocks and backing
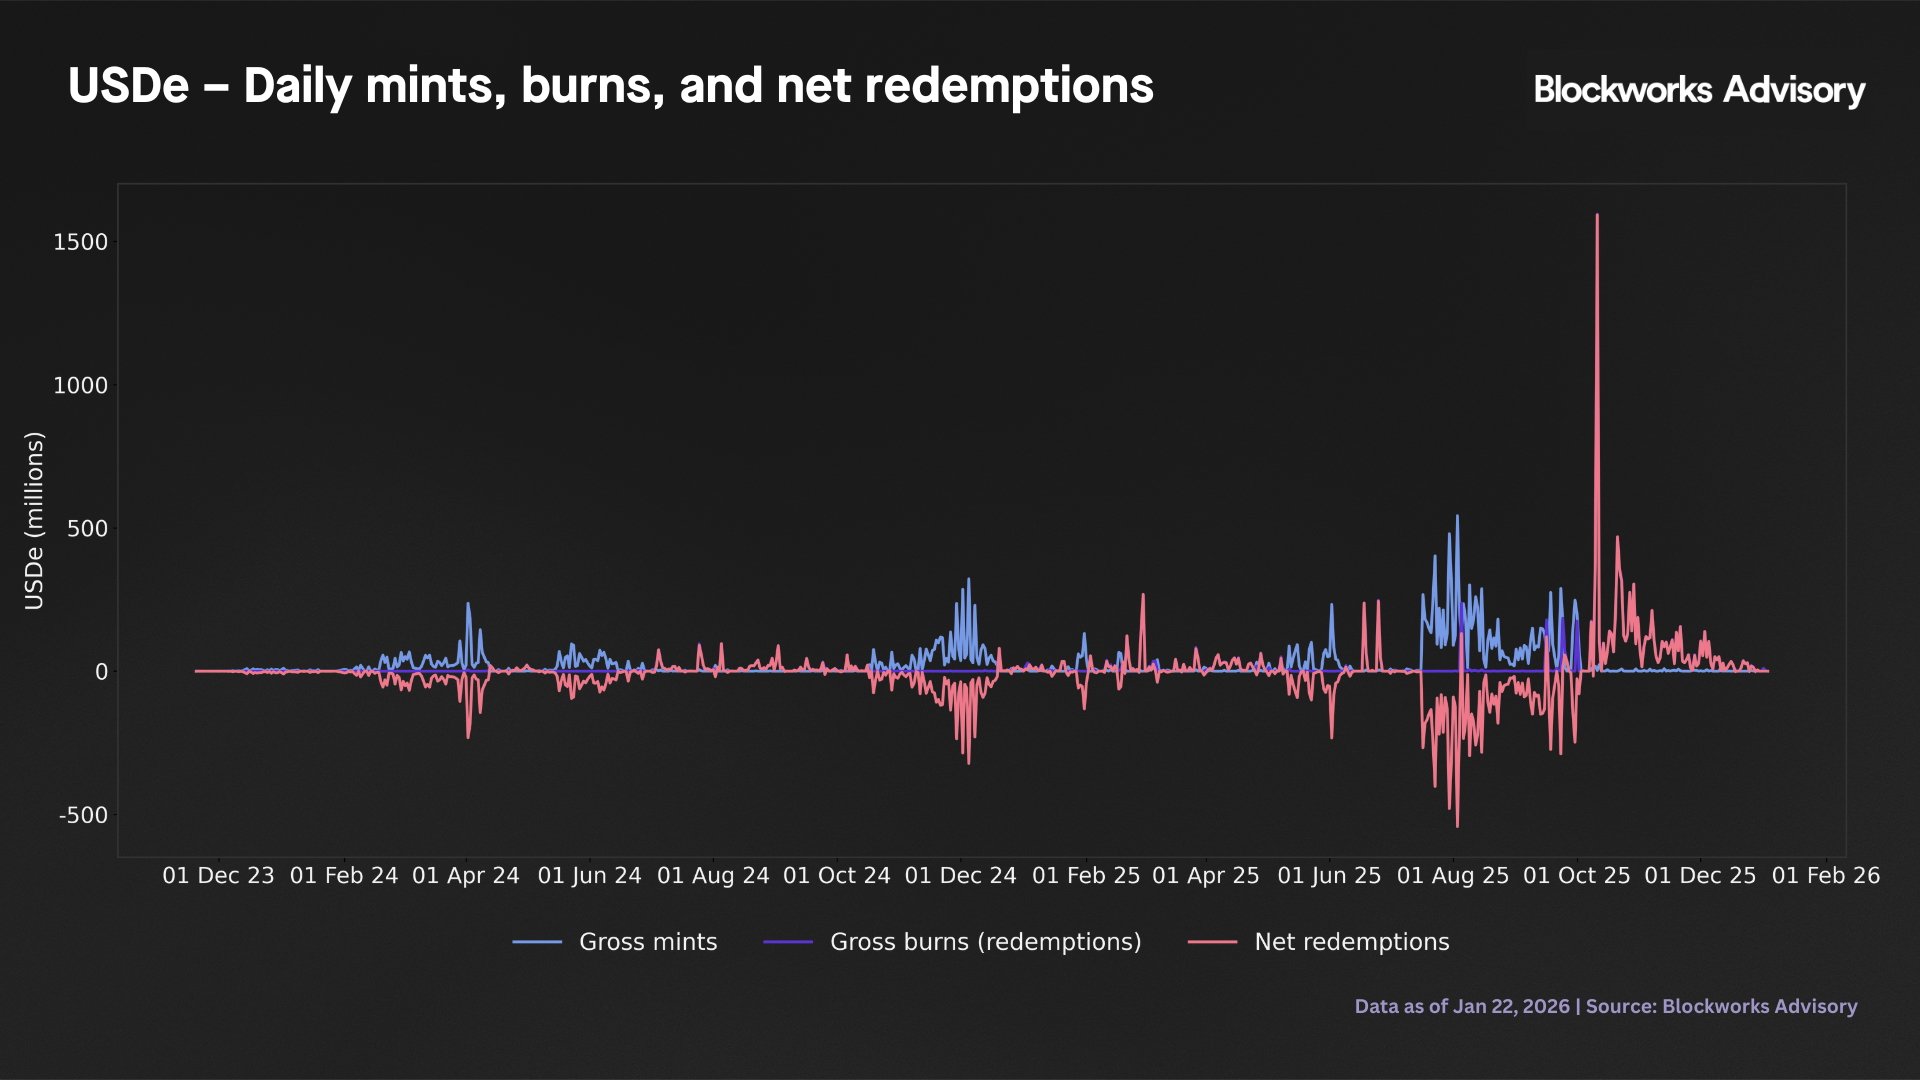
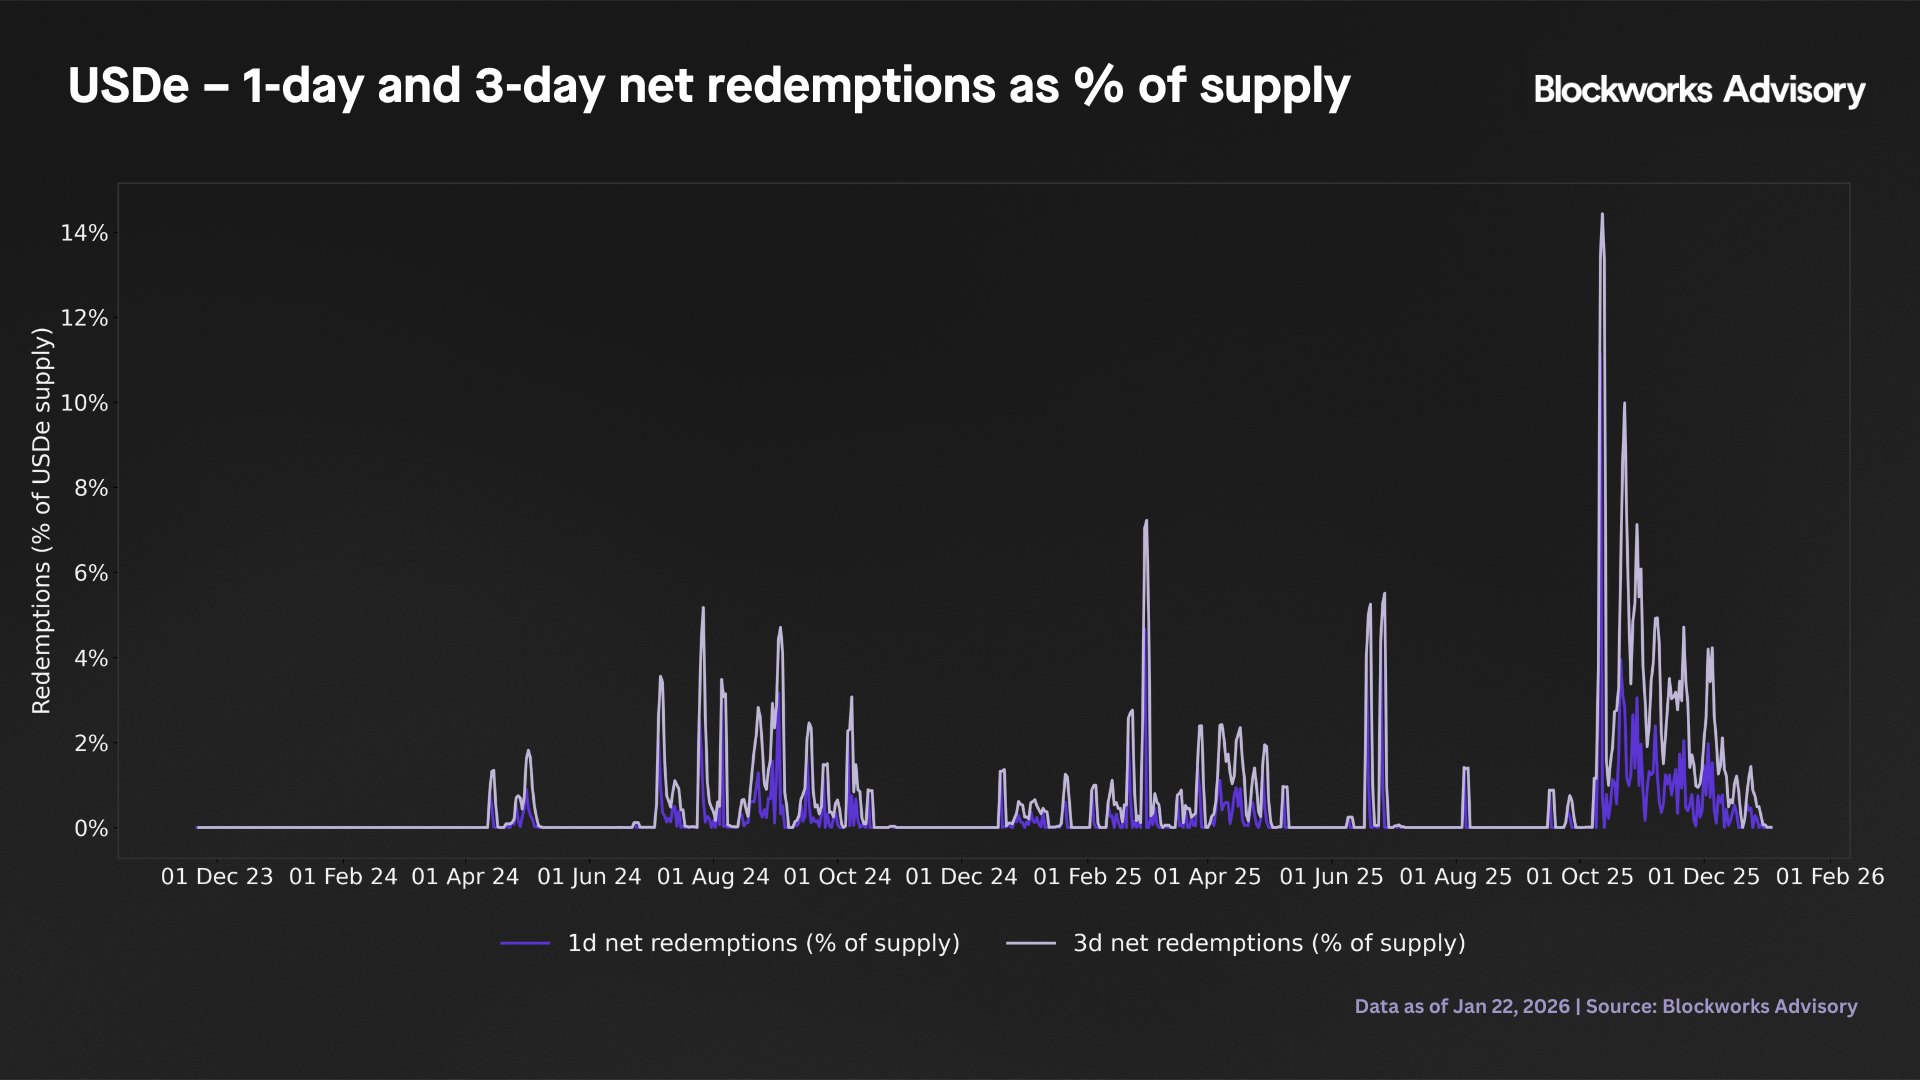
Using mints and burns from the issuance panel, we construct an outflow only metric of net redemptions (burns minus mints, truncated at zero so that issuance never offsets redemptions within the window). On this basis, the 99th percentile 1-day net redemption is about 351m USDe, corresponding to roughly 4.0% of outstanding supply, while the 99th percentile 3-day cumulative net redemption reaches about 1.02bn USDe, or 8.6% of supply. The largest single day net redemption in the sample is approximately 1.59bn USDe, or 11.1% of supply. These figures should be interpreted as conservative stress benchmarks for balance sheet shrinkage, as they deliberately ignore offsetting issuance within the horizon.
We then compare these shocks to the liquidity available in the onchain mint/redeem contract. The coverage ratio averages 1.51% over the sample, with a range from about 0.54% to 4.78%. In other words, the always on onchain redemption bucket is sized at low single digit percentages of liabilities. On average, mint/redeem balances cover about 1.51% of USDe supply, while the 99th percentile 1-day net redemption shock is approximately 4.0% of supply. The ratio 1.51%/4.0% = 0.38 implies that the onchain bucket would, on average, fund only about 38% of a 99th percentile 1-day redemption episode, with the remainder needing to be met via (i) liquidating or converting backing assets into stablecoins and moving them into the redemption channel sufficiently quickly, and/or (ii) secondary market liquidity on CEXs and DEXs.
On a solvency basis, the reported backing ratio is consistently above unity but with a relatively thin overcollateralization band. Over the full sample the backing ratio ranges from 1.005 to 1.037, with a median of about 1.011 and 5th - 95th percentiles at roughly 1.006 and 1.019. The ratio never falls below 1.0, indicating continuous full backing in reported terms, but the buffer above par is modest (on the order of 0.5% - 3.7%). In the 10 - 11 October 2025 stress window, the median backing ratio is around 1.005 compared with roughly 1.011 in normal periods, i.e. tilted towards the lower end of its historical range but still clearly above unity, consistent with a mild compression.
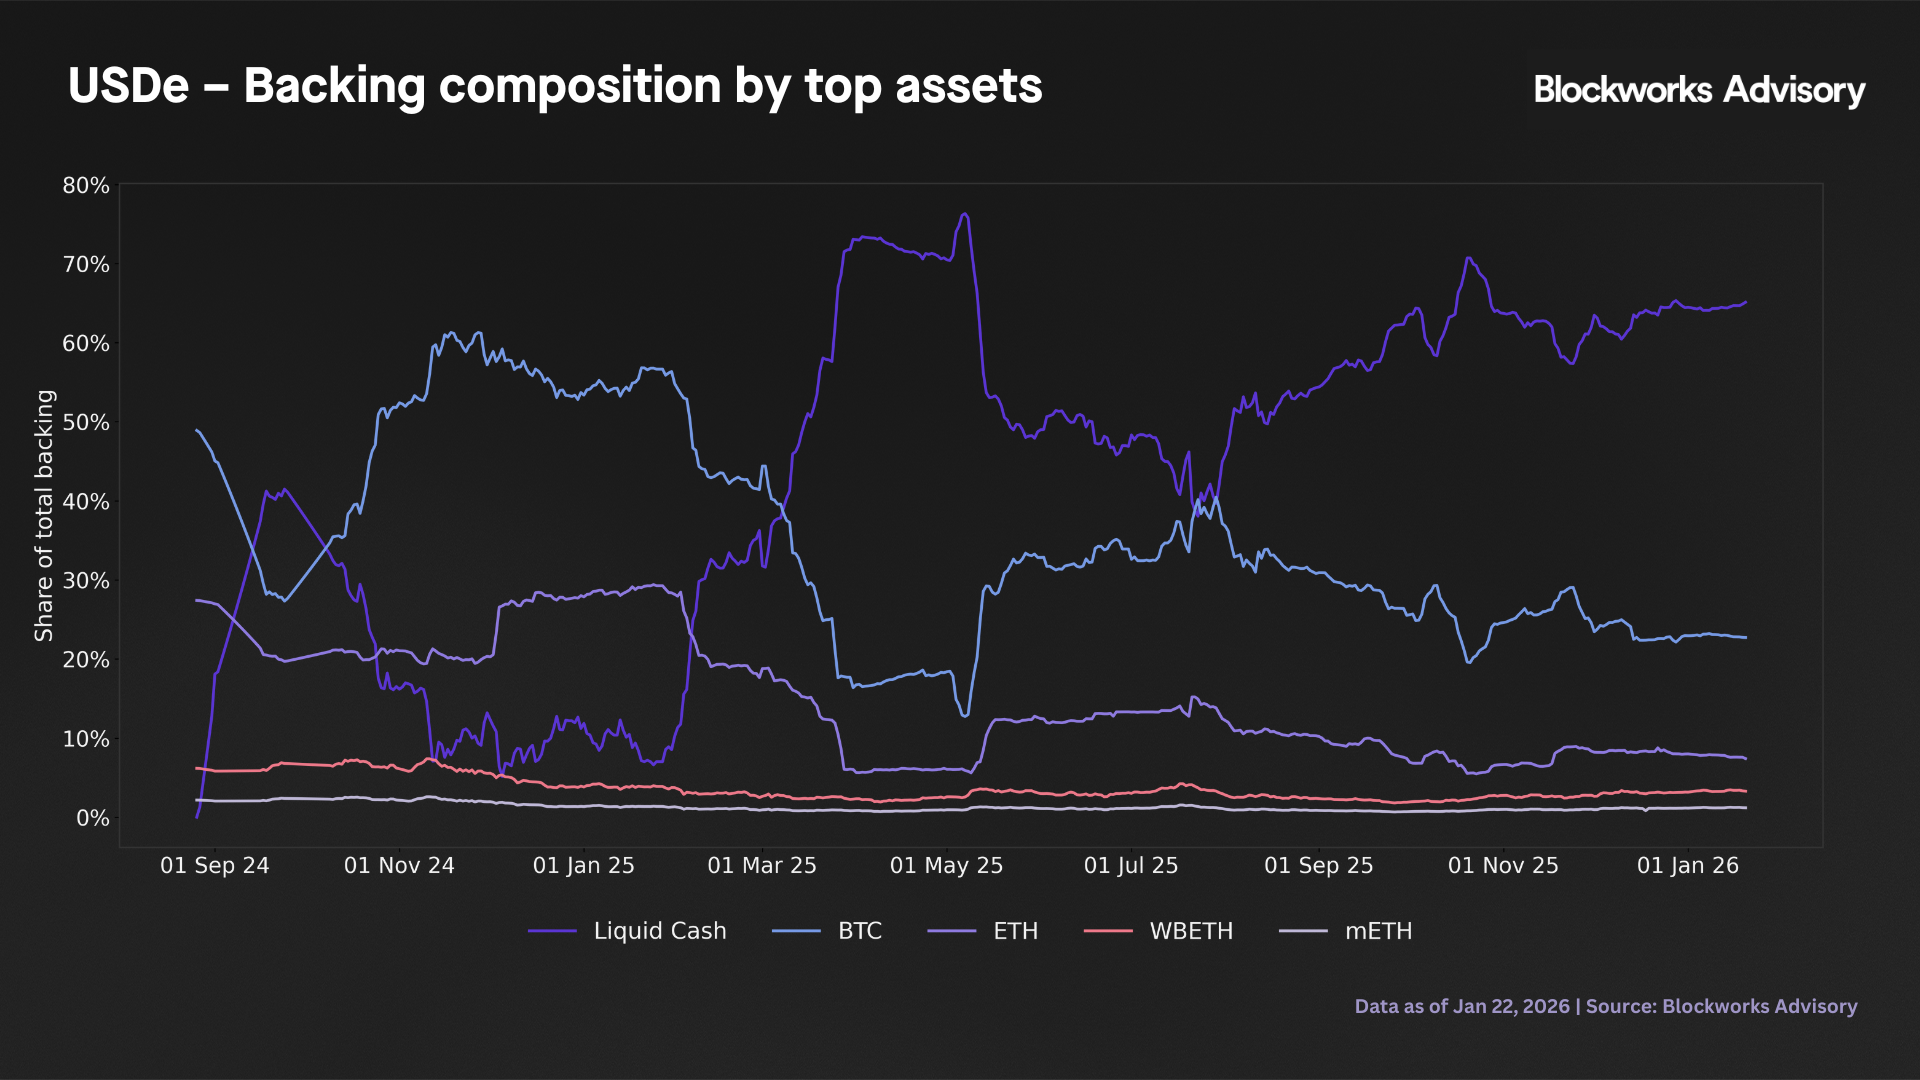
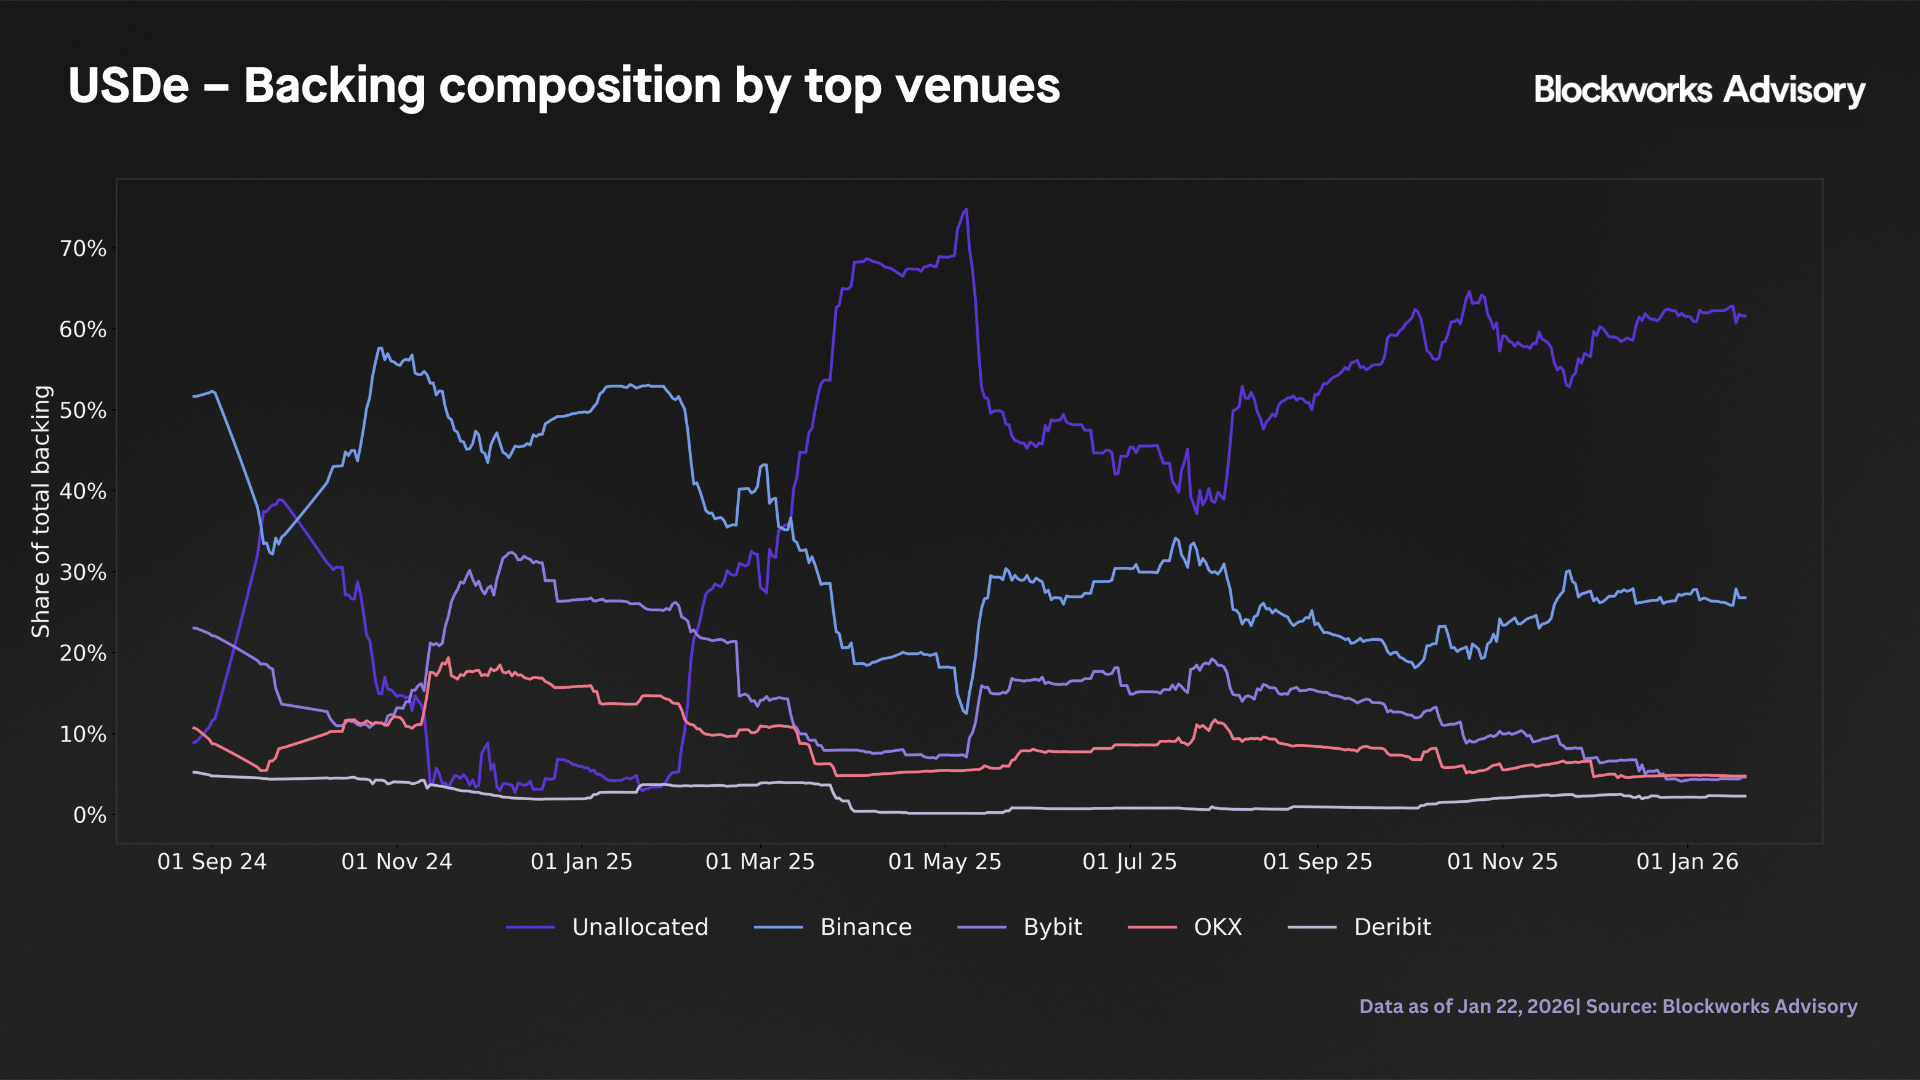
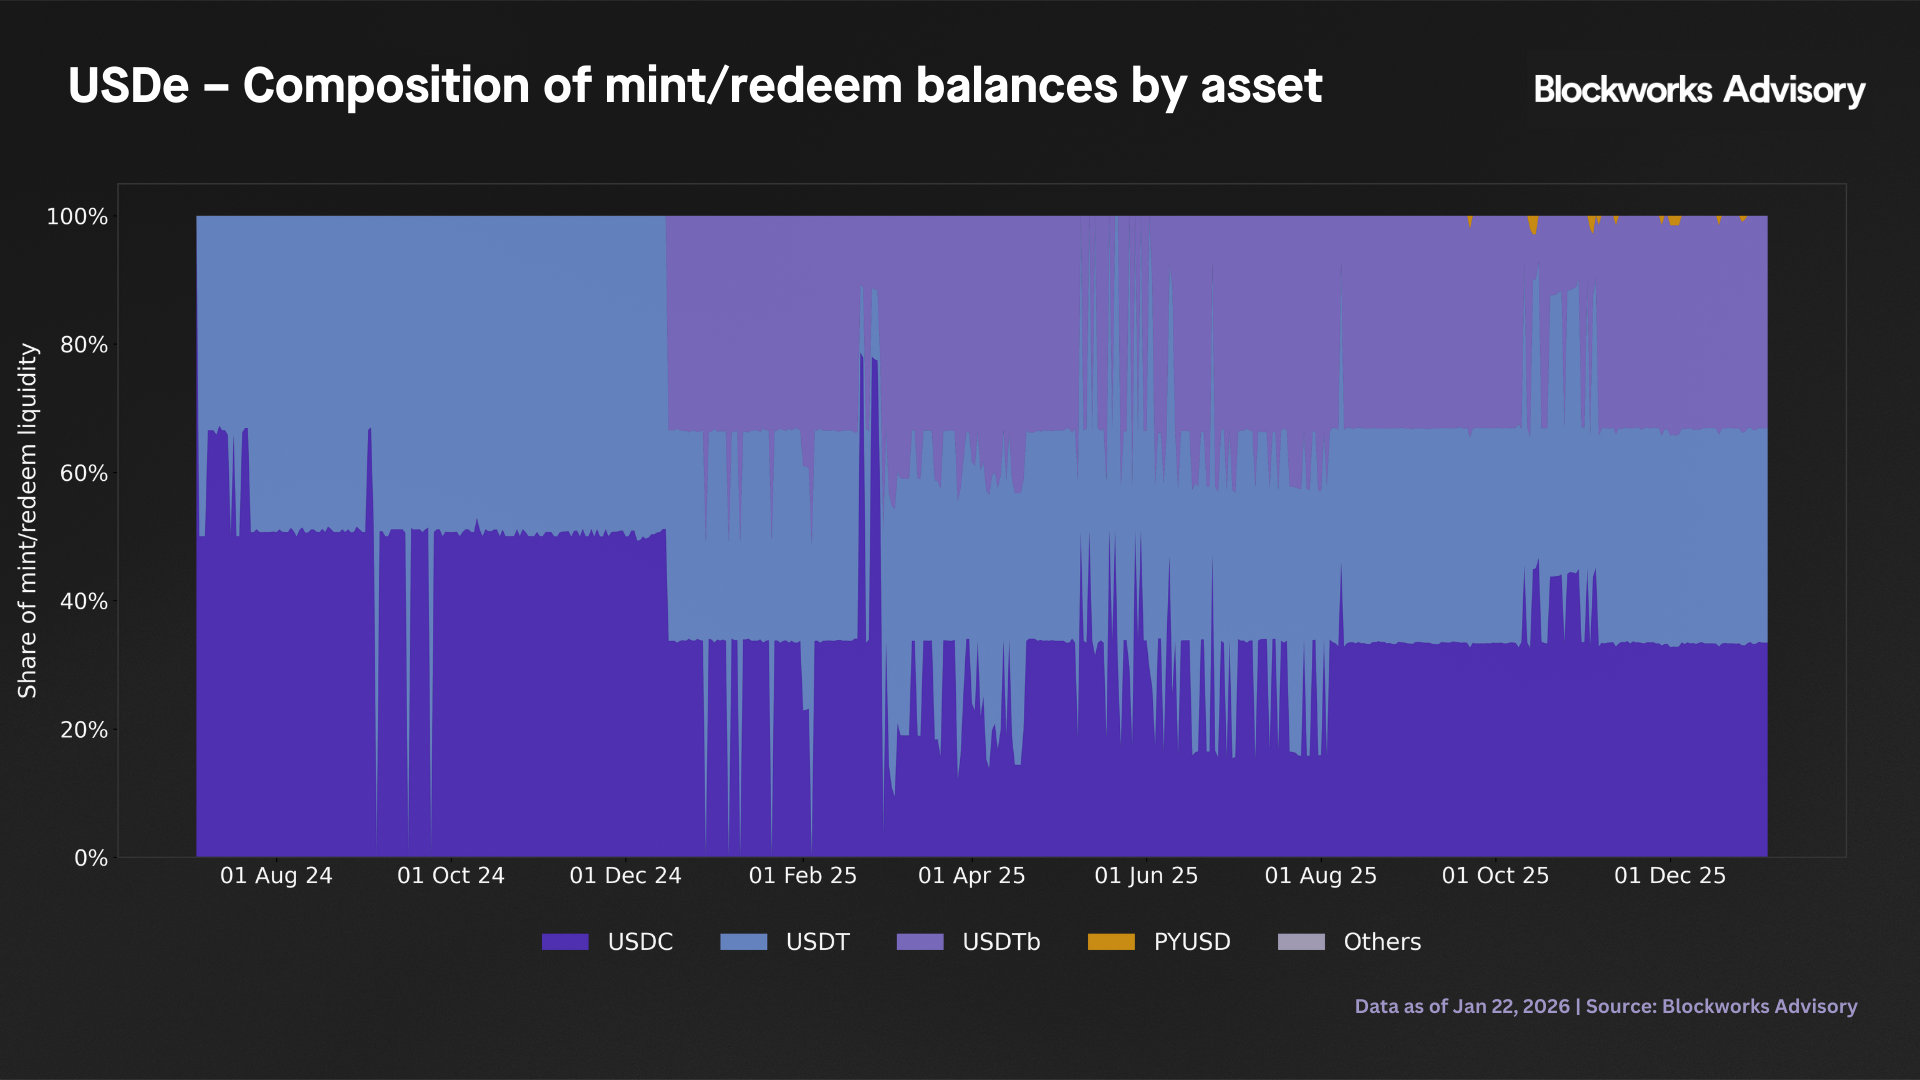
The composition of the mint/redeem contract itself remains extremely conservative: throughout the sample, 100% of this bucket is held in stablecoins (primarily USDC, USDT, and USDTb). The broader backing structure is dominated by a mix of "Liquid Cash" (43.8% average share) and major crypto and liquid staking assets including BTC (34.9%), ETH (14.7%), WBETH (3.6%), mETH (1.3%), and stETH (1.2%). This backing is concentrated across a small number of major venues and buckets, with the top five being "Unallocated" (40.5%), Binance (33.1%), Bybit (15.1%), OKX (9.0%), and Deribit (2.2%).
Taken together, the results of this step indicate that USDe has maintained full reported collateralization, but with a relatively thin solvency margin (median 1.1% overcollateralization) and a very small always on redemption buffer (average 1.5% of supply), such that the system's ability to withstand large redemption shocks is highly contingent on continued access to centralized venues and effective internal liquidity management.
3. sUSDe - USDe pricing and basis
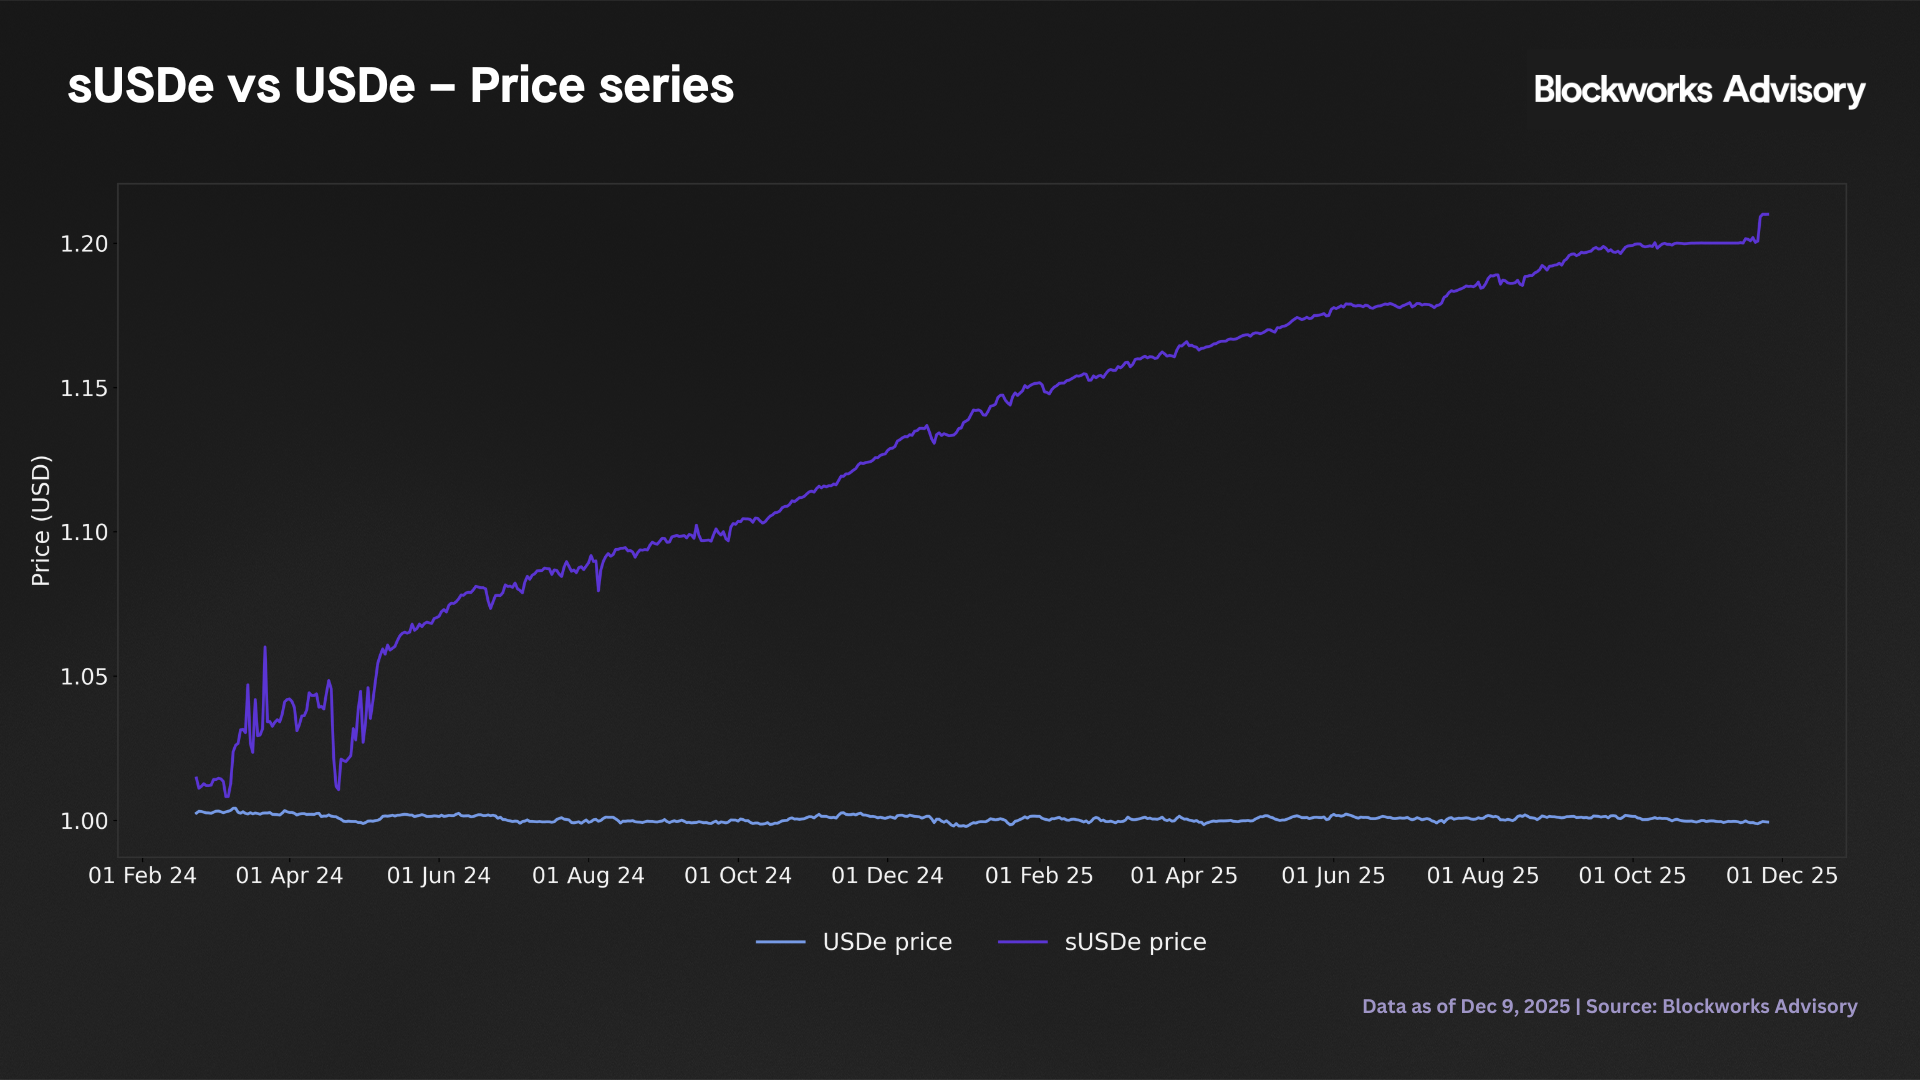
This section measures the sUSDe/USDe basis using aggregated secondary market prices (CoinPaprika, sourcing DEX and CEX venues), so the premium captured here reflects what investors pay for sUSDe in the market relative to USDe, not the deviation of the market price from its NAV. Step 3 examines the pricing of the yield bearing sUSDe relative to its underlying USDe and the stability of USDe's own peg. Over the sample, this basis is strongly positive on average, sUSDe trades at a mean premium of about 1,364 bps and a median premium of 1,498 bps to USDe. In level terms this implies that, in typical conditions, sUSDe is valued roughly 14 - 15% above USDe, consistent with accrued yield and, at times, embeds an additional convenience or demand premium for staking exposure.
The basis distribution is relatively tight. The 95th percentile is around 2,105 bps and the 99th percentile about 2,191 bps, with the maximum observed basis reaching 2,200 bps (22%) over the sample period. This narrow range between the p99 and maximum (only 9 bps spread) indicates that extreme outliers are largely absent from the sample, suggesting that the sUSDe/USDe pricing relationship has remained well behaved throughout the period. The absence of fat tailed basis events is notable and implies that sUSDe pricing has been stable relative to potential dislocations that could occur under thin liquidity or venue specific anomalies.
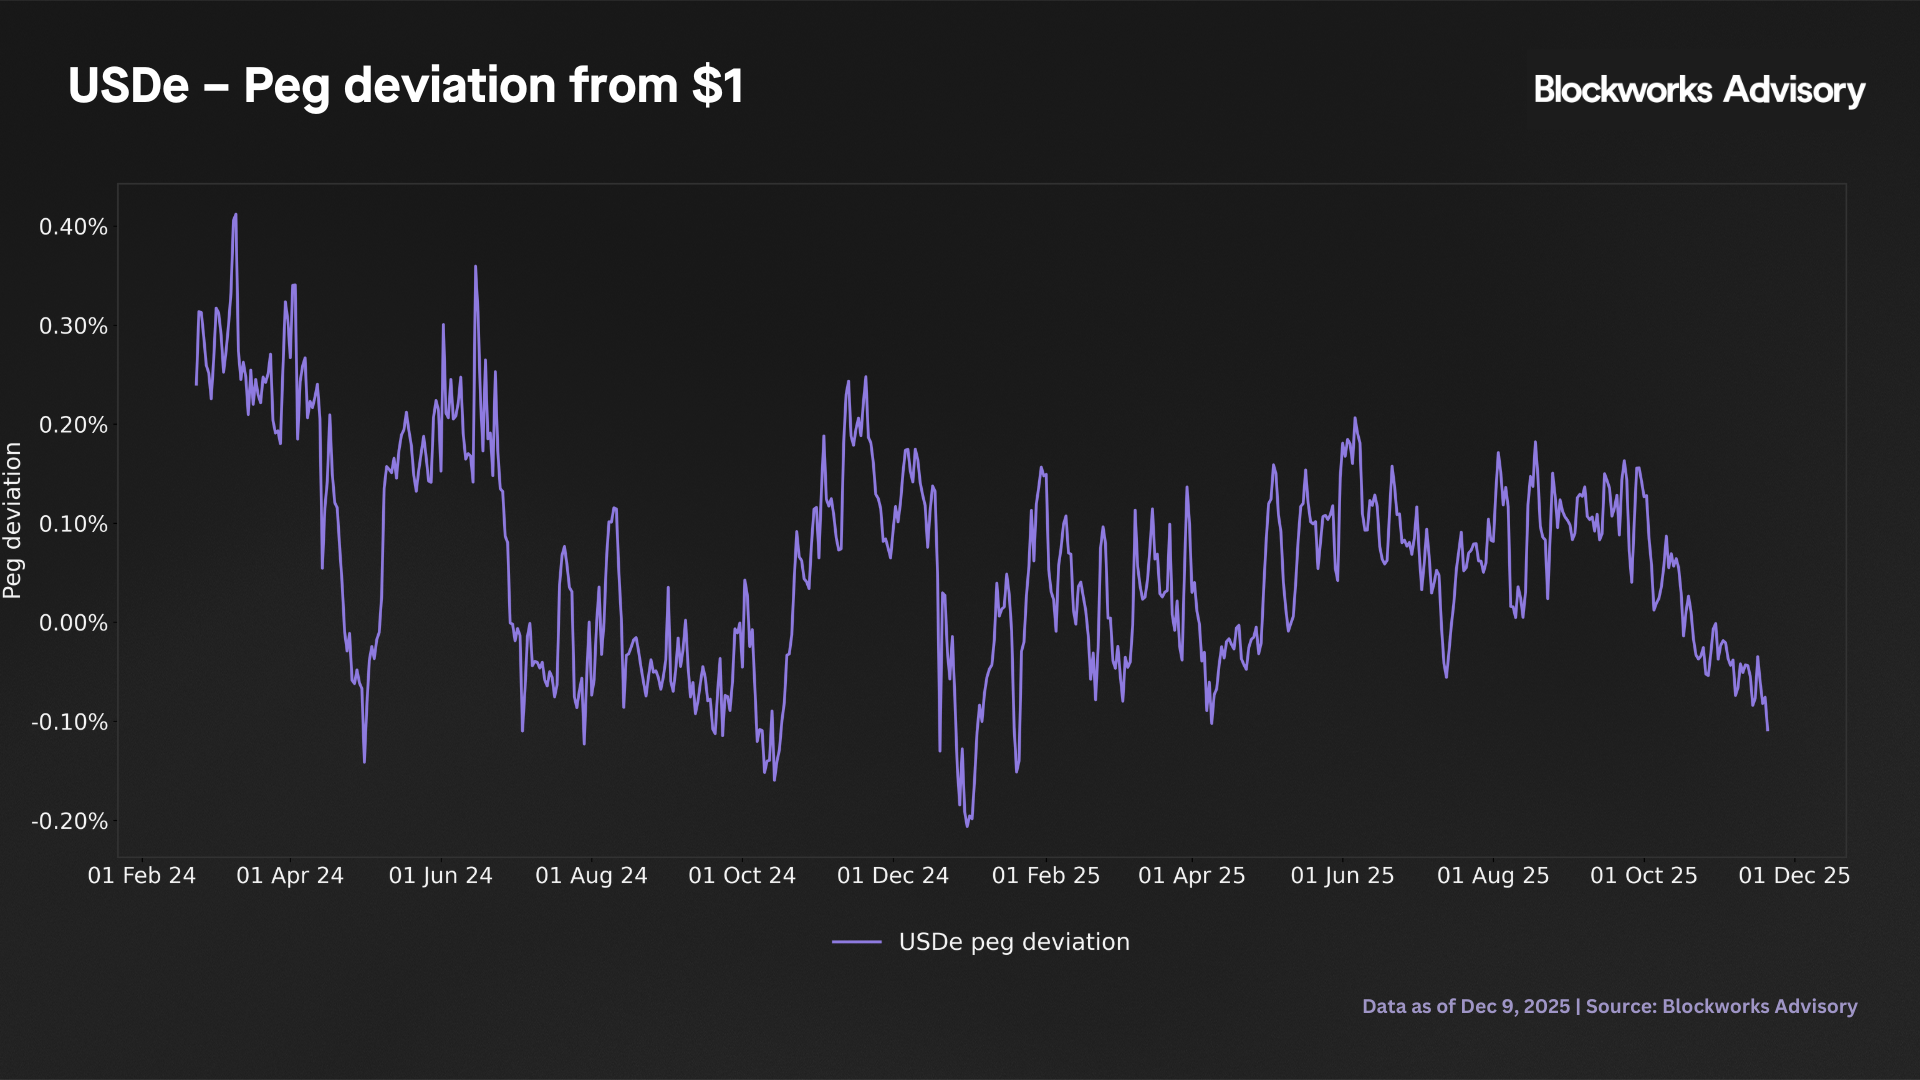
By contrast, USDe's own peg is very tight. The absolute deviation of the USDe VWAP from its $1 peg averages only about 6 bps, with a 95th percentile of 25 bps, a 99th percentile of 32 bps, and a maximum of 41 bps over the sample. In other words, USDe itself behaves like a well anchored stablecoin, and the order of magnitude of peg noise is two orders smaller than the typical sUSDe/USDe basis. From a risk perspective, most of the price risk borne by sUSDe holders at the secondary market level is not stablecoin depegging risk but the sensitivity of the secondary market price to flow imbalances around a structurally growing NAV as yield accrues, the fair value of sUSDe rises steadily against USDe, and the secondary market price tracks that growth with additional variation driven by demand dynamics.
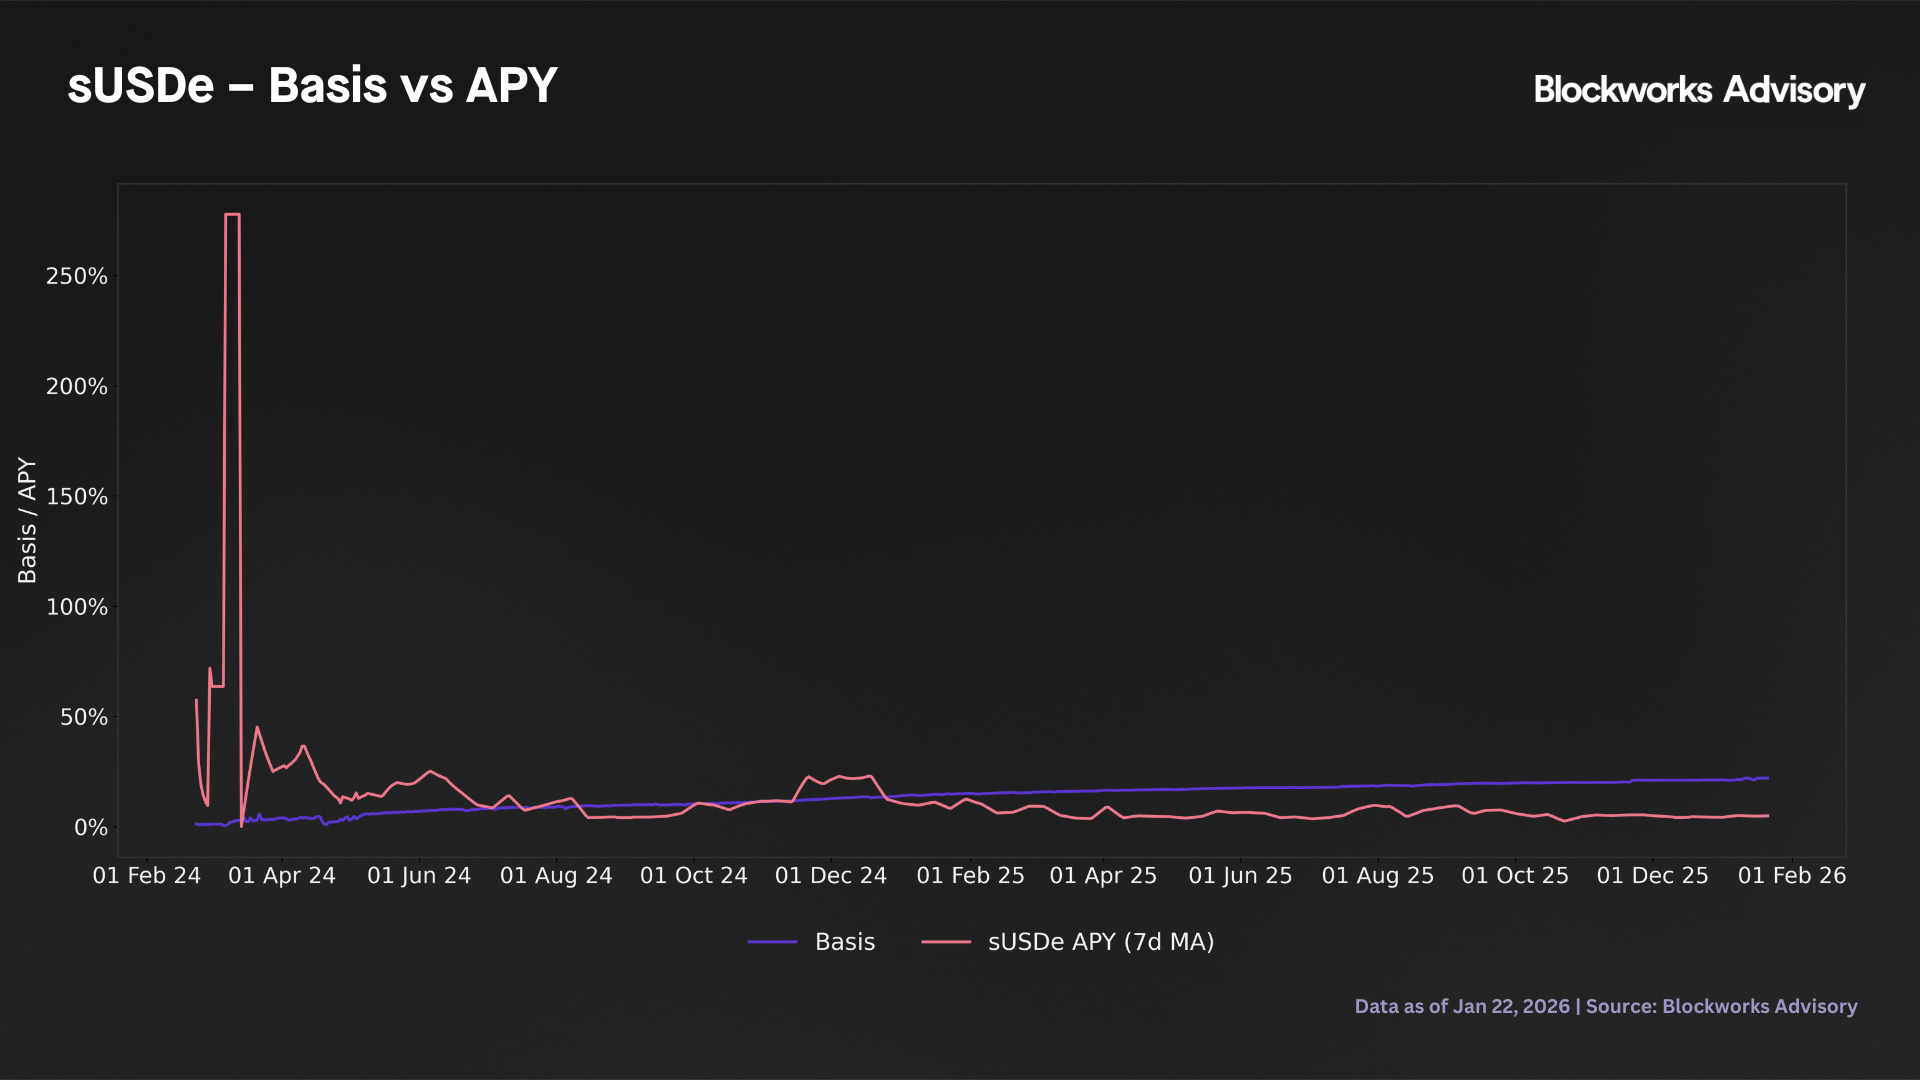
The simple correlation diagnostics reveal important patterns in basis dynamics. The correlation between the basis and the reported APY is weakly negative (-0.16), indicating that short term movements in the quoted yield explain little of the day to day variation in the premium, and if anything, higher yields are associated with slightly compressed premia. In practice, the level of APY appears to set the structural incentive for holding or looping sUSDe, but does not tightly control the daily pricing of the wrapper once other frictions (liquidity, leverage constraints, funding conditions) are taken into account.
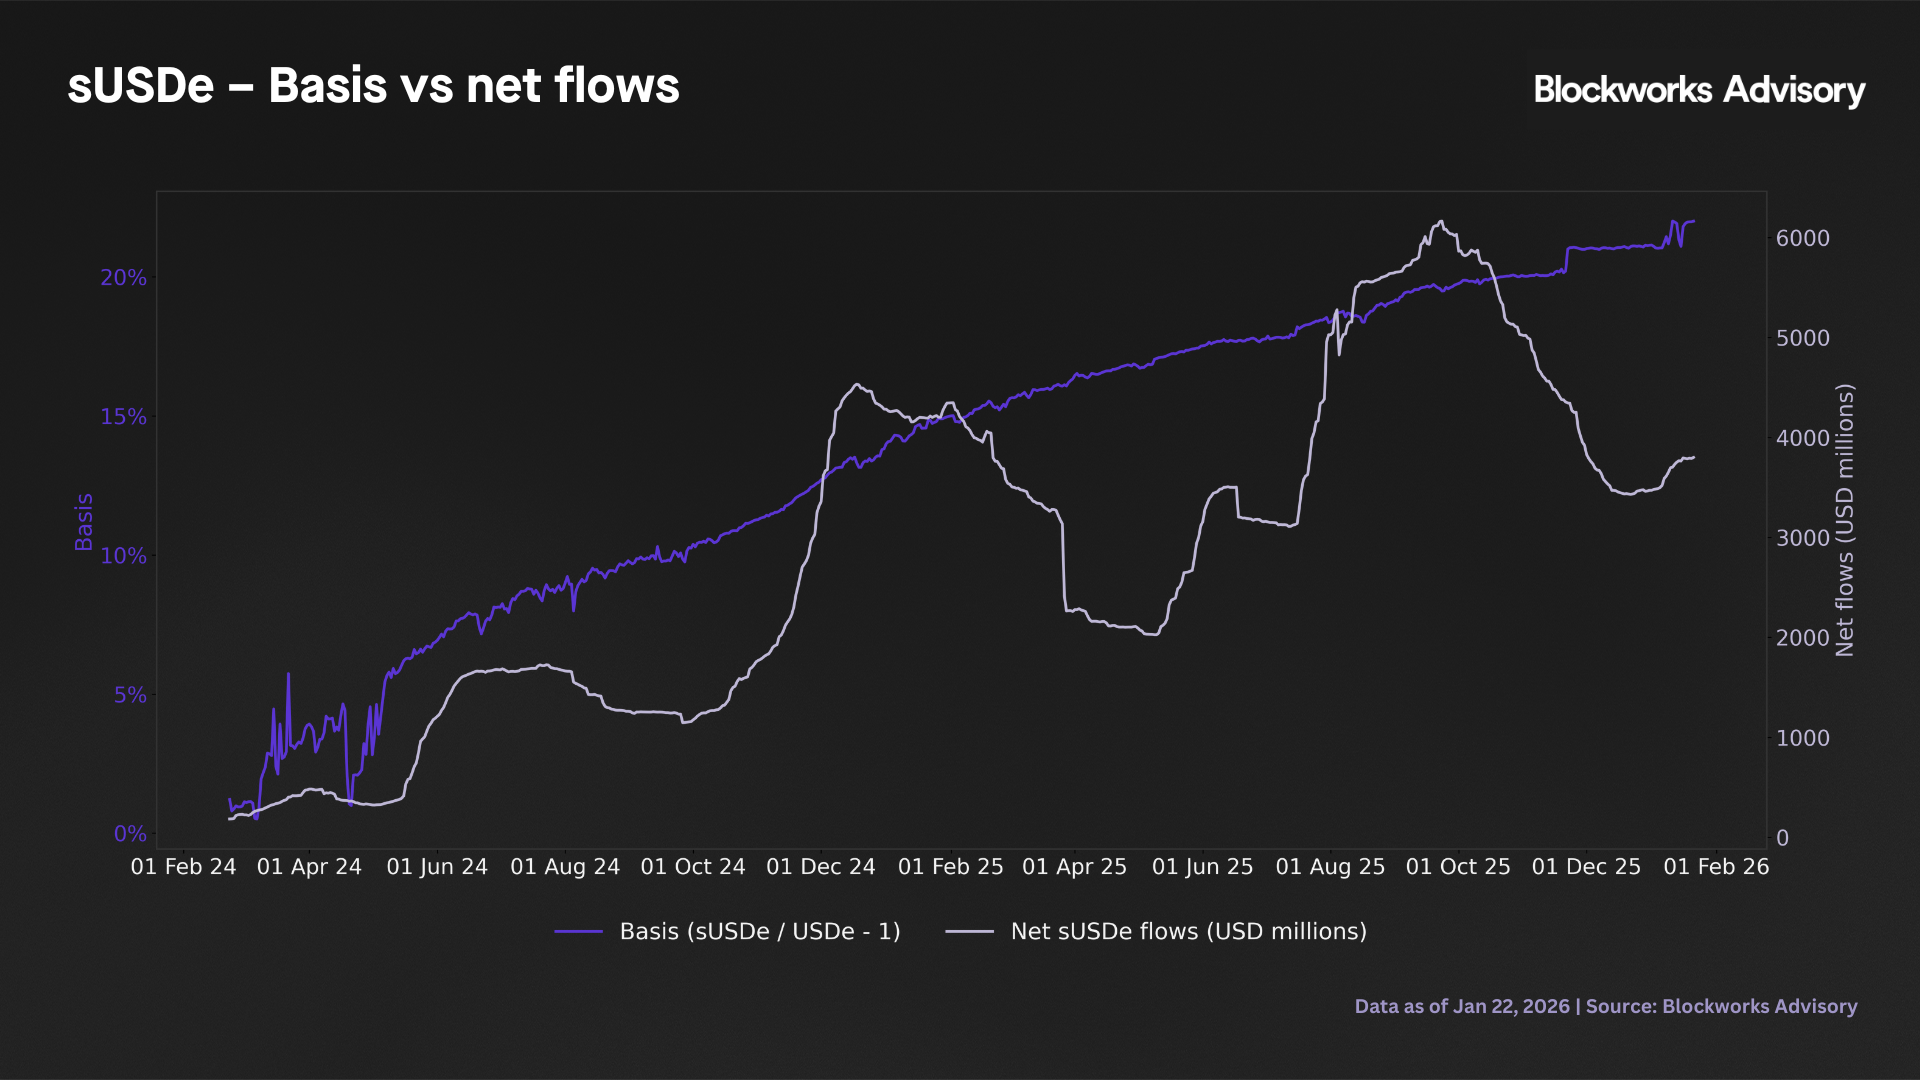
By contrast, the correlation between the basis and net flows into sUSDe is very strongly positive (0.84), suggesting a strong comovement between flows and the premium level, though both series trend upward over the sample and the correlation partly reflects shared time-series dynamics rather than a clean causal relationship. Strong inflows are highly associated with elevated premia, either because demand pressure directly pushes prices up relative to USDe, or because investors chase already high premia. This comovement is consistent with flows playing a role in basis dynamics, though isolating the causal channel would require analysis in first differences or on detrended series.
The correlation between the basis and USDe's own peg deviation is moderately negative (-0.36), suggesting that when USDe deviates below peg. The sUSDe premium tends to widen somewhat since a lower USDe price reduces the denominator of the basis ratio and directly widens the computed premium, independently of any behavioral response. Though the relationship is not dominant and USDe peg noise neither systematically amplifies nor fully explains sUSDe's premium dynamics.
Taken together, the results of this step suggest the following risk interpretation. First, sUSDe has functioned as a structurally premium wrapper over USDe, with a large positive basis that reflects accrued yield and demand for leveraged or staked exposure. Second, the basis distribution is relatively tight with no extreme outliers, indicating that wrapper pricing has remained stable even during potential stress periods. The maximum basis of 22% and the narrow p99 to max range suggest that microstructure or venue specific dislocations have been minimal. Third, USDe's own peg has been highly stable, so wrapper level price risk clearly dominates underlying stablecoin risk in this sample. Finally, the very strong link between basis and flows (correlation of 0.84), and the weak inverse link with APY, indicate that basis dynamics comove strongly with flows, partly reflecting shared trends, with implications for how changes in queue design or liquidity conditions might propagate into pricing.
4. DEX liquidity and market behaviour (USDe and sUSDe)
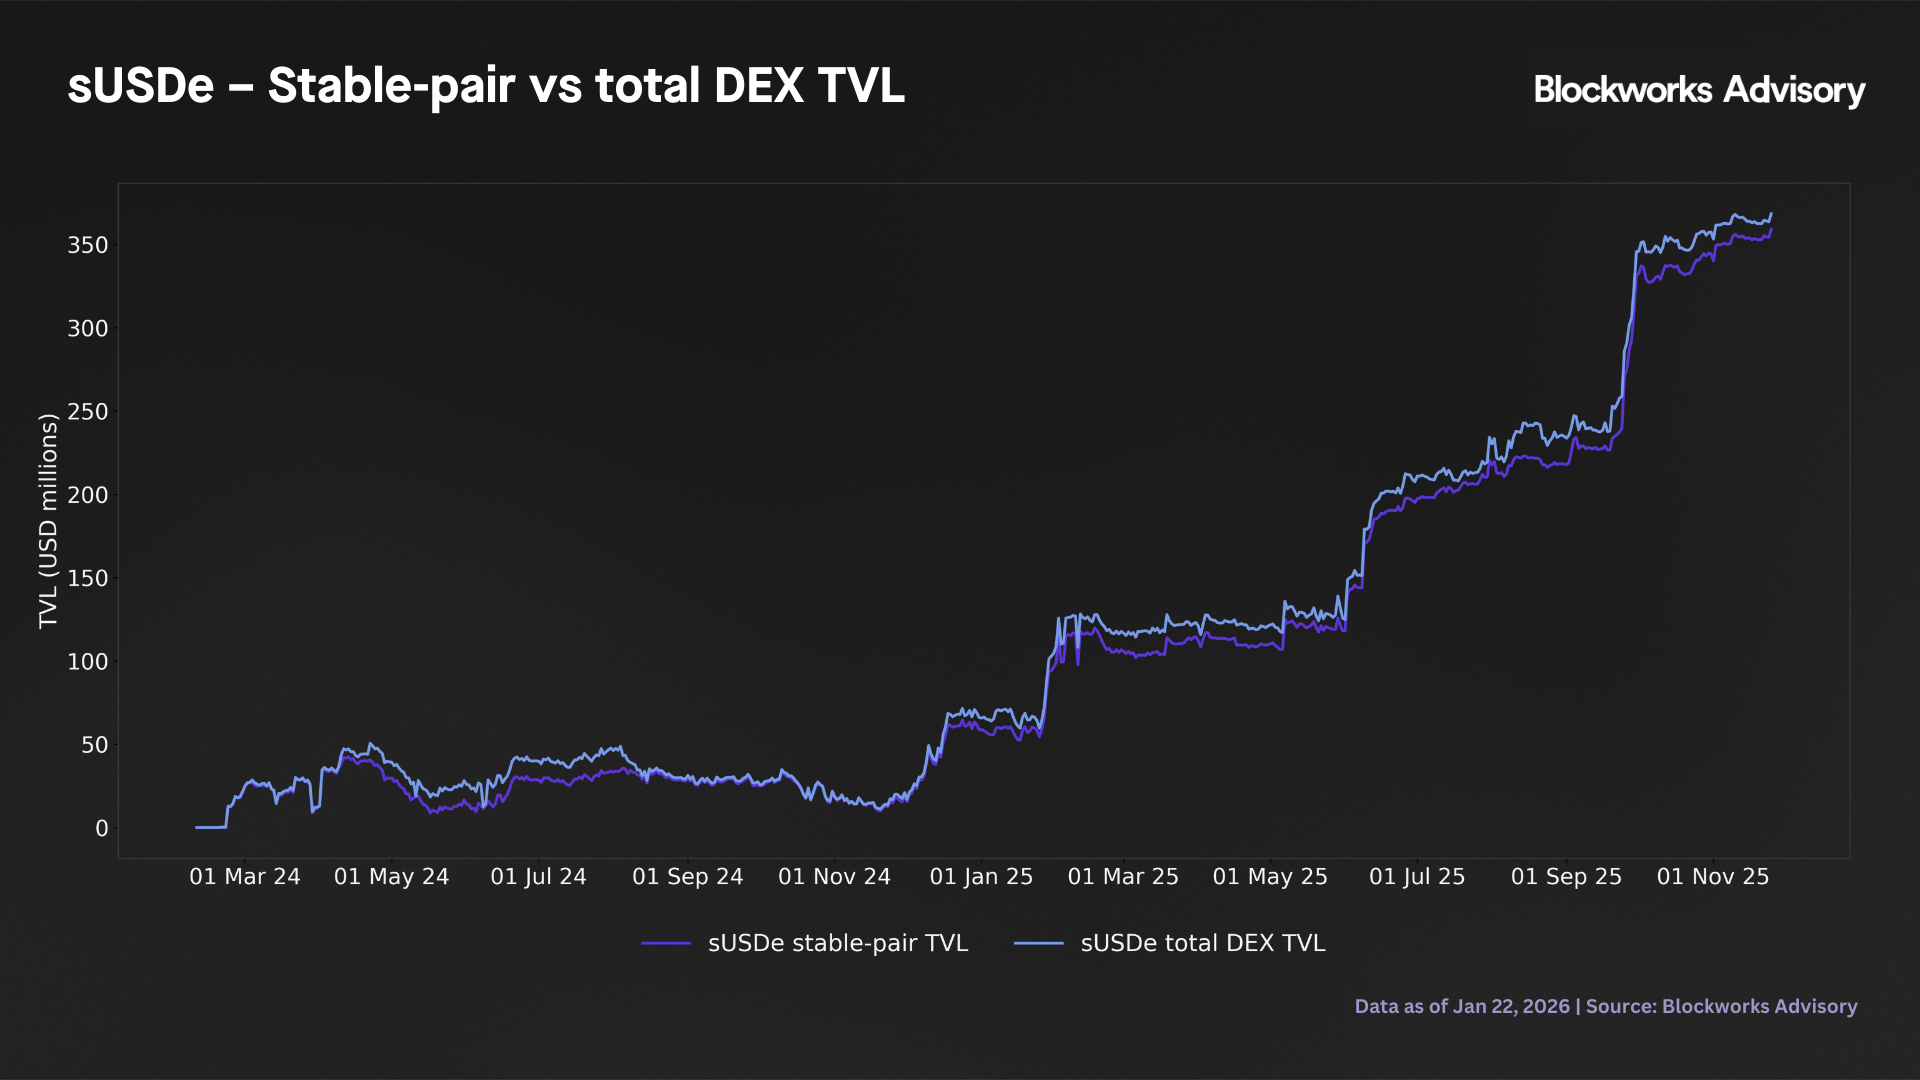
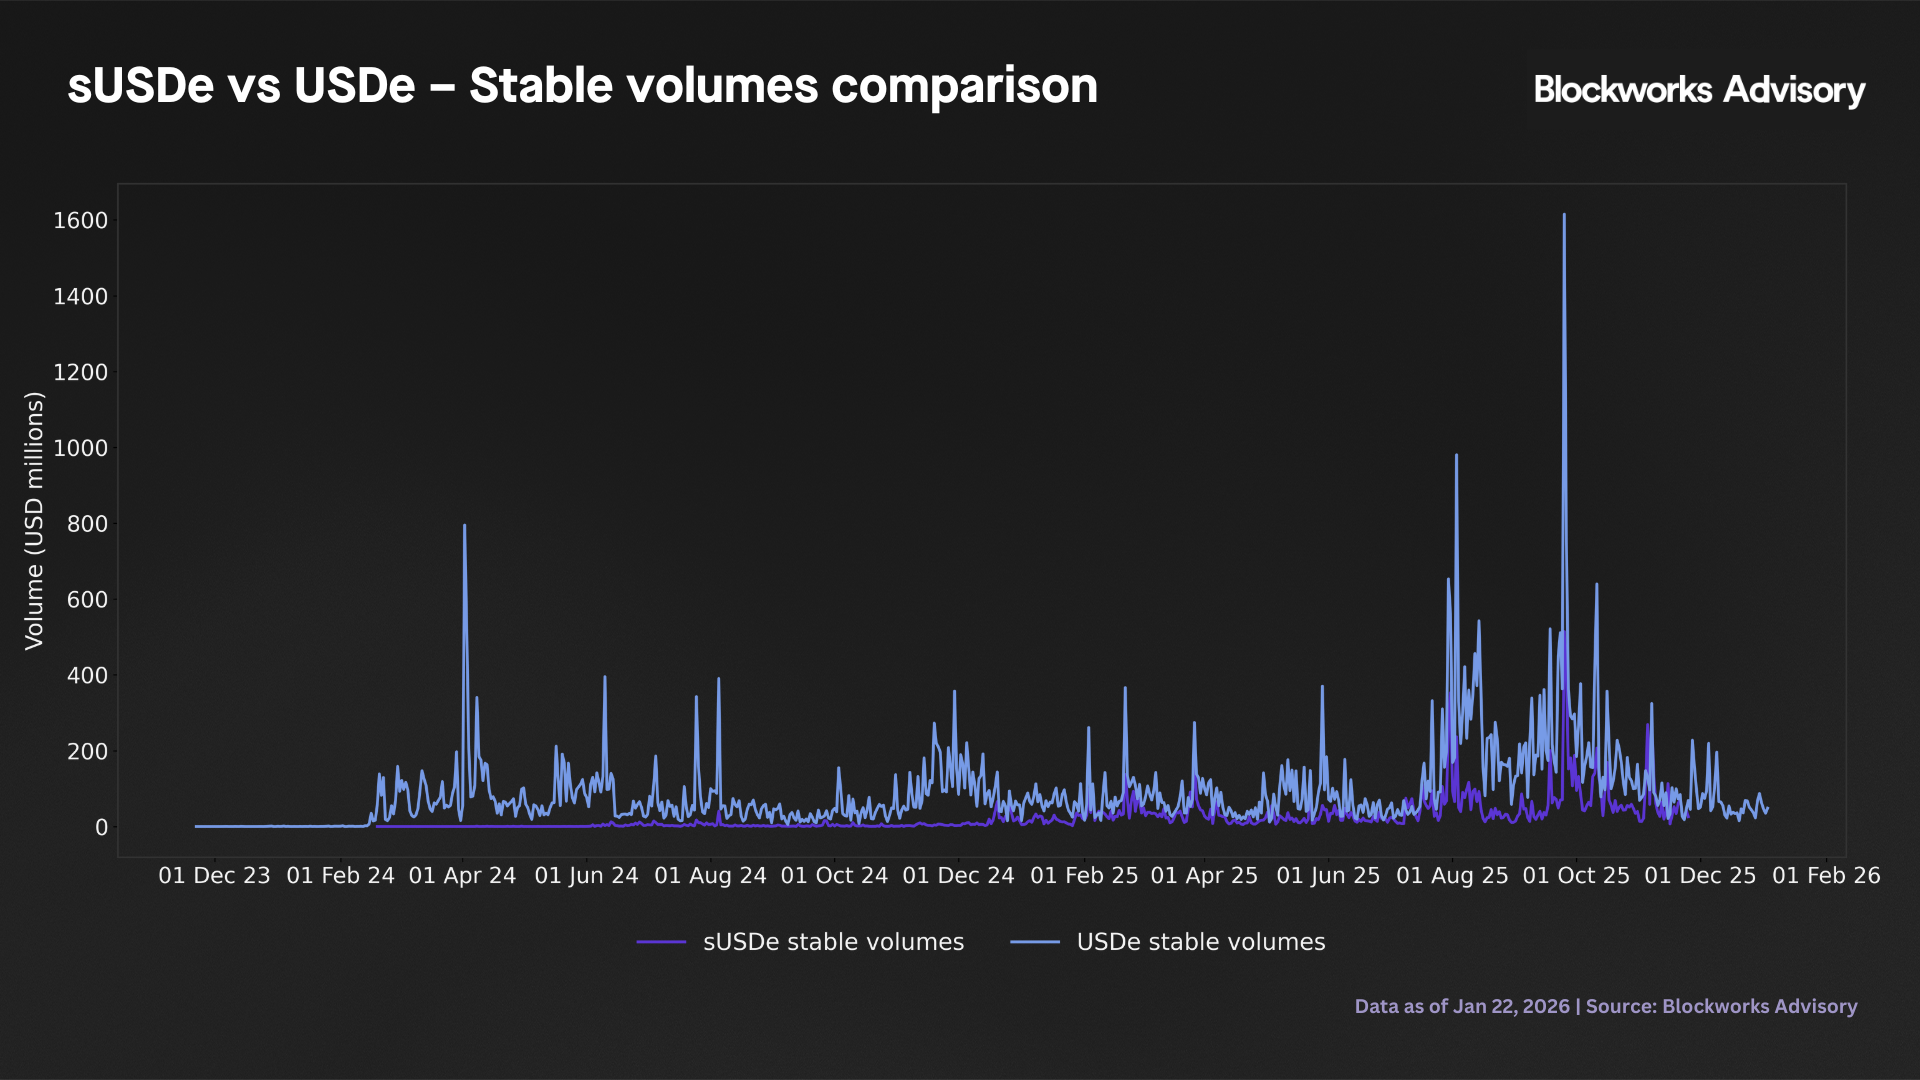
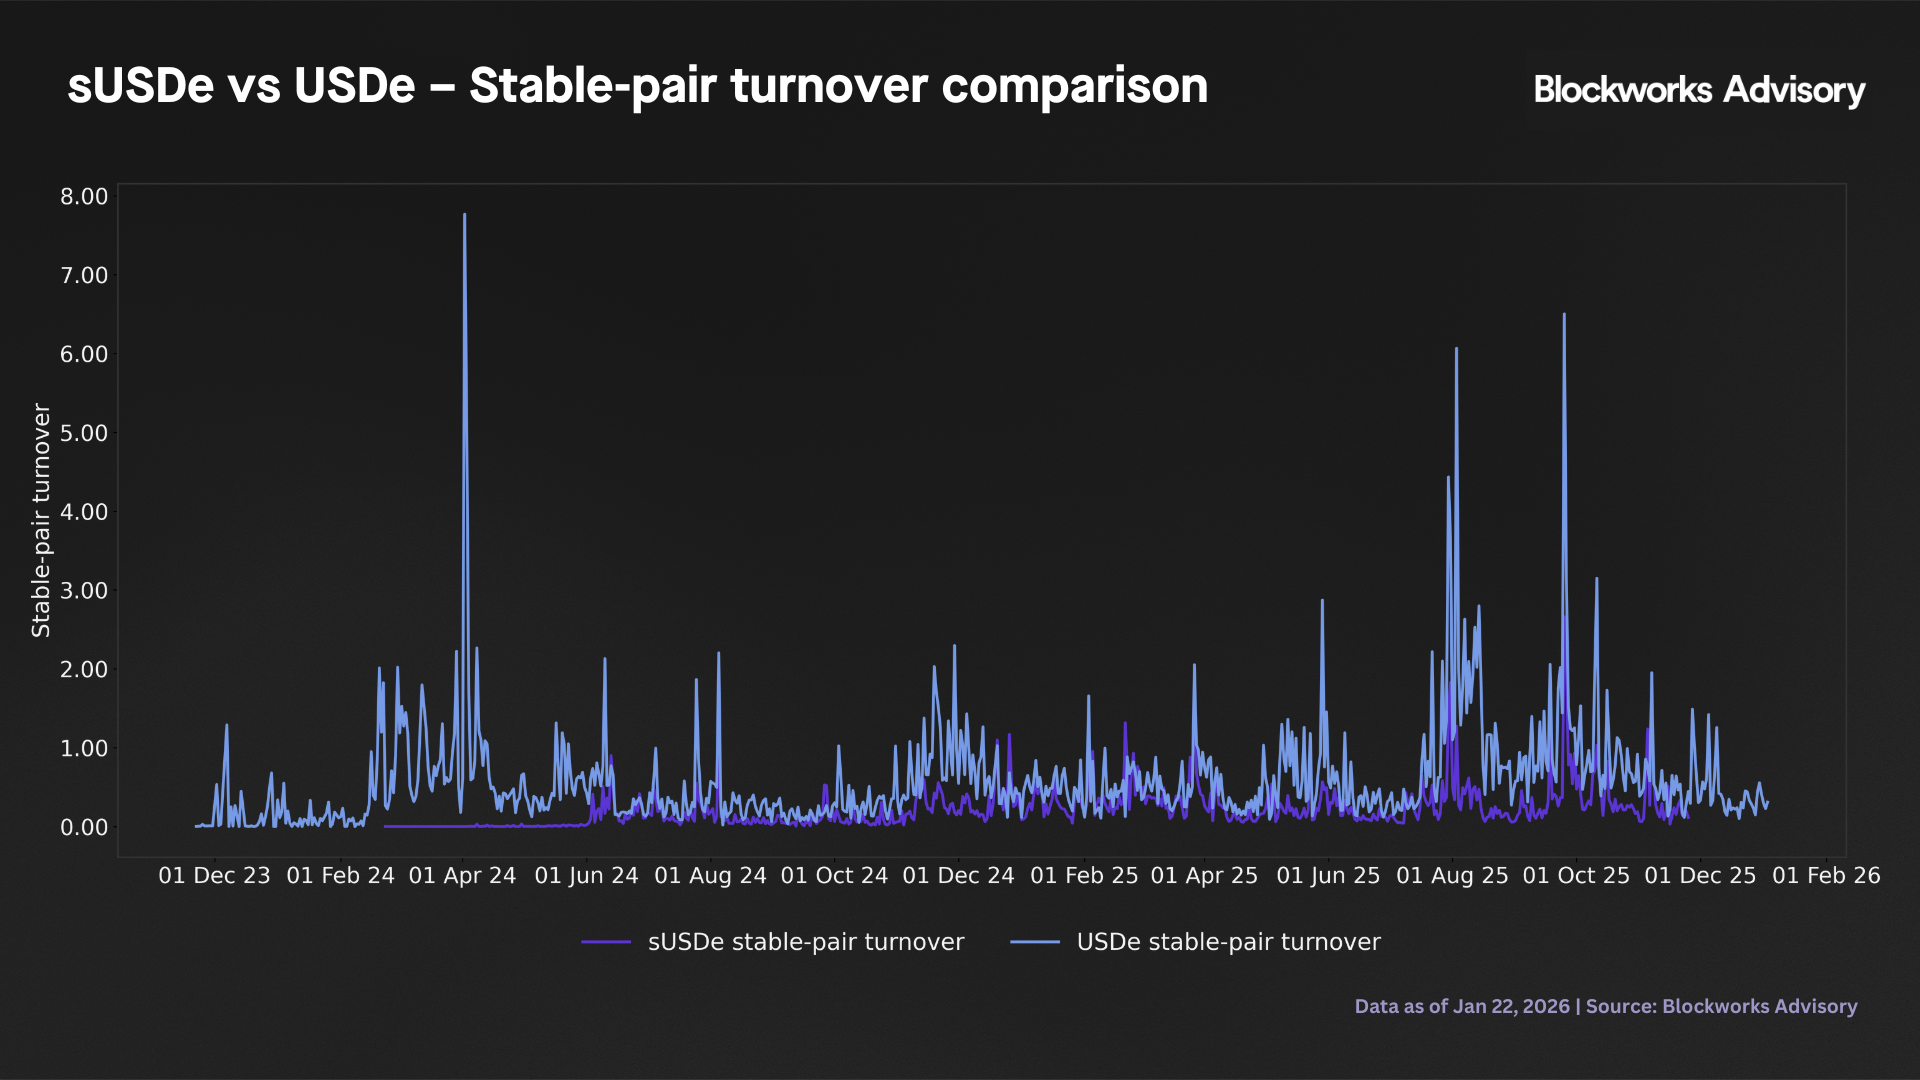
This step analyzes how onchain secondary market liquidity for sUSDe and USDe behaved during the 10 - 11 October 2025 stress window relative to normal conditions. For sUSDe, the stress window coincides with a sharp expansion of onchain liquidity and a very large increase in trading activity. Average stable pair TVL during 10 - 11 October is about 331.2m USD, roughly 3.1× the normal period mean of 105.4m USD (noting that the normal period mean spans the full sample including early low TVL observations, so this ratio partly reflects the growth trajectory of the pools over time rather than stress driven liquidity provision alone), and total DEX TVL rises from around 113.6m USD in normal conditions to about 346.8m USD in the stress window. Stable pair volumes increase even more strongly with average daily volume against stables jumping from 25.6m USD in normal days to roughly 174.0m USD in the stress window (around 6.8× higher), while total DEX volume rises from 37.2m USD to about 210.1m USD (5.7×). When scaled by available liquidity, the intensification is equally visible. Stable pair turnover increases from roughly 0.20× per day in normal conditions to about 0.53× per day in the stress window (2.6× the normal level), and total turnover rises from 0.50× to about 0.61× per day (1.4×). Put differently, sUSDe's DEX pools become both deeper and significantly more active during stress where more capital is parked in liquidity pools and that capital is rotated through trades at a higher frequency, particularly against stable pairs.
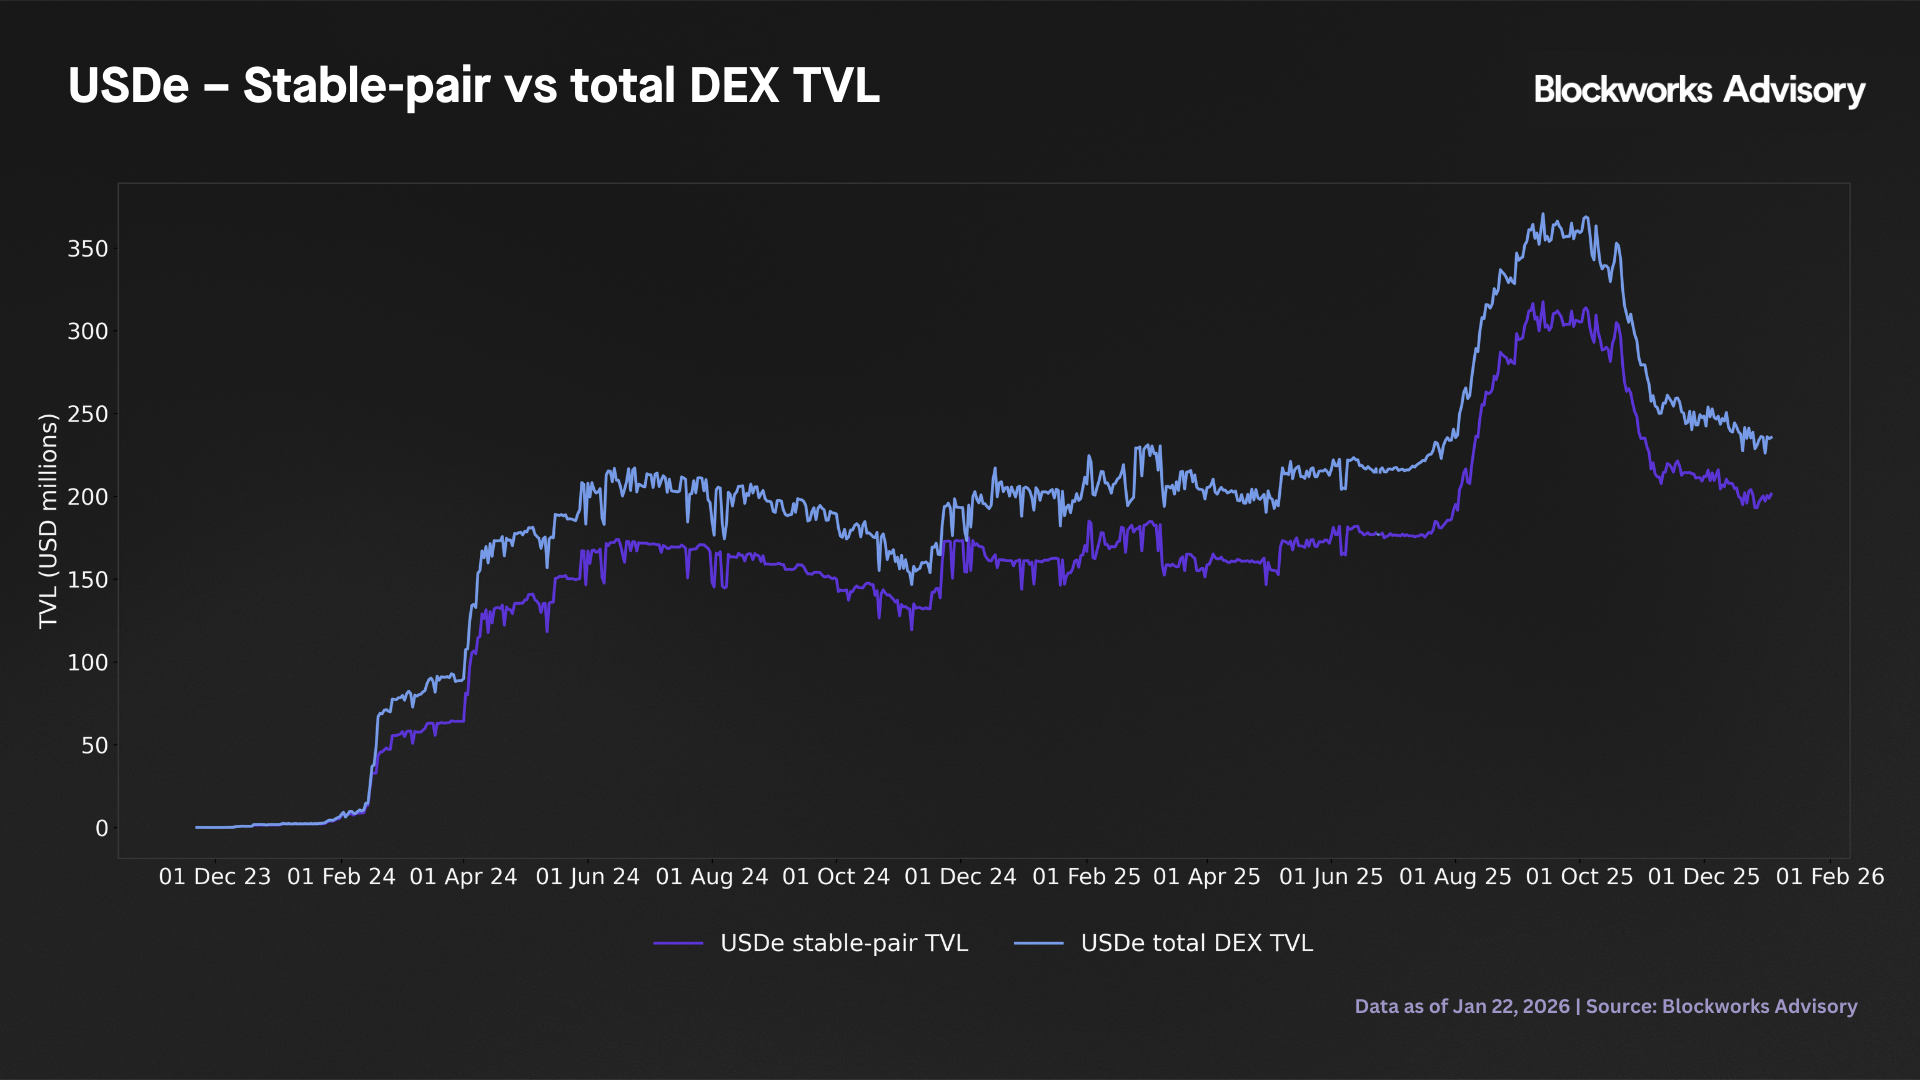
For USDe itself, the dynamics are directionally similar, with stress associated with both larger pools and much higher trading intensity. Stable pair TVL increases from an average of 155.8m USD in normal conditions to around 297.1m USD in the stress window (1.9×), and total DEX TVL rises from roughly 190.6m USD to about 345.9m USD (1.8×). Trading activity scales up even more aggressively with stable pair volumes climbing from around 90.9m USD per day in normal periods to roughly 532.1m USD during the stress window (5.9×), while total DEX volume increases from about 101.9m USD to 617.9m USD (6.1×). The corresponding turnover ratios reflect this regime shift. Stable turnover rises from about 0.55× per day in normal conditions to roughly 1.79× per day (3.6× higher), and total turnover from 0.50× to around 1.79× per day (3.6×). In other words, during the October 2025 episode, USDe DEX pools are not only maintained but actively scaled up and they intermediate a multiple of their usual daily flow.
These findings should be interpreted with caution given the very small size of the stress sample (two observations), and they are descriptive rather than the outcome of a formal event study. Subject to that caveat, the evidence suggests that the October 2025 stress did not trigger any deterioration of DEX liquidity for USDe or sUSDe. If anything, the system relied on deeper pools and substantially higher onchain trading velocity to absorb flows. From a risk standpoint, this pattern is broadly reassuring in that onchain markets continued to provide meaningful execution venues for both the underlying asset and its staked wrapper at a time of stress. At the same time, the combination of elevated turnover and concentrated stress period activity implies that price impact and slippage for directional flows may still be material, even when headline TVL is high. These dynamics should, therefore, feed directly into the sizing of acceptable loop leverage, queue design, and redemption day liquidity requirements. Stress episodes are likely to manifest as bursts of high velocity trading through DEX pools.
5. Cross-chain and holder concentration of USDe
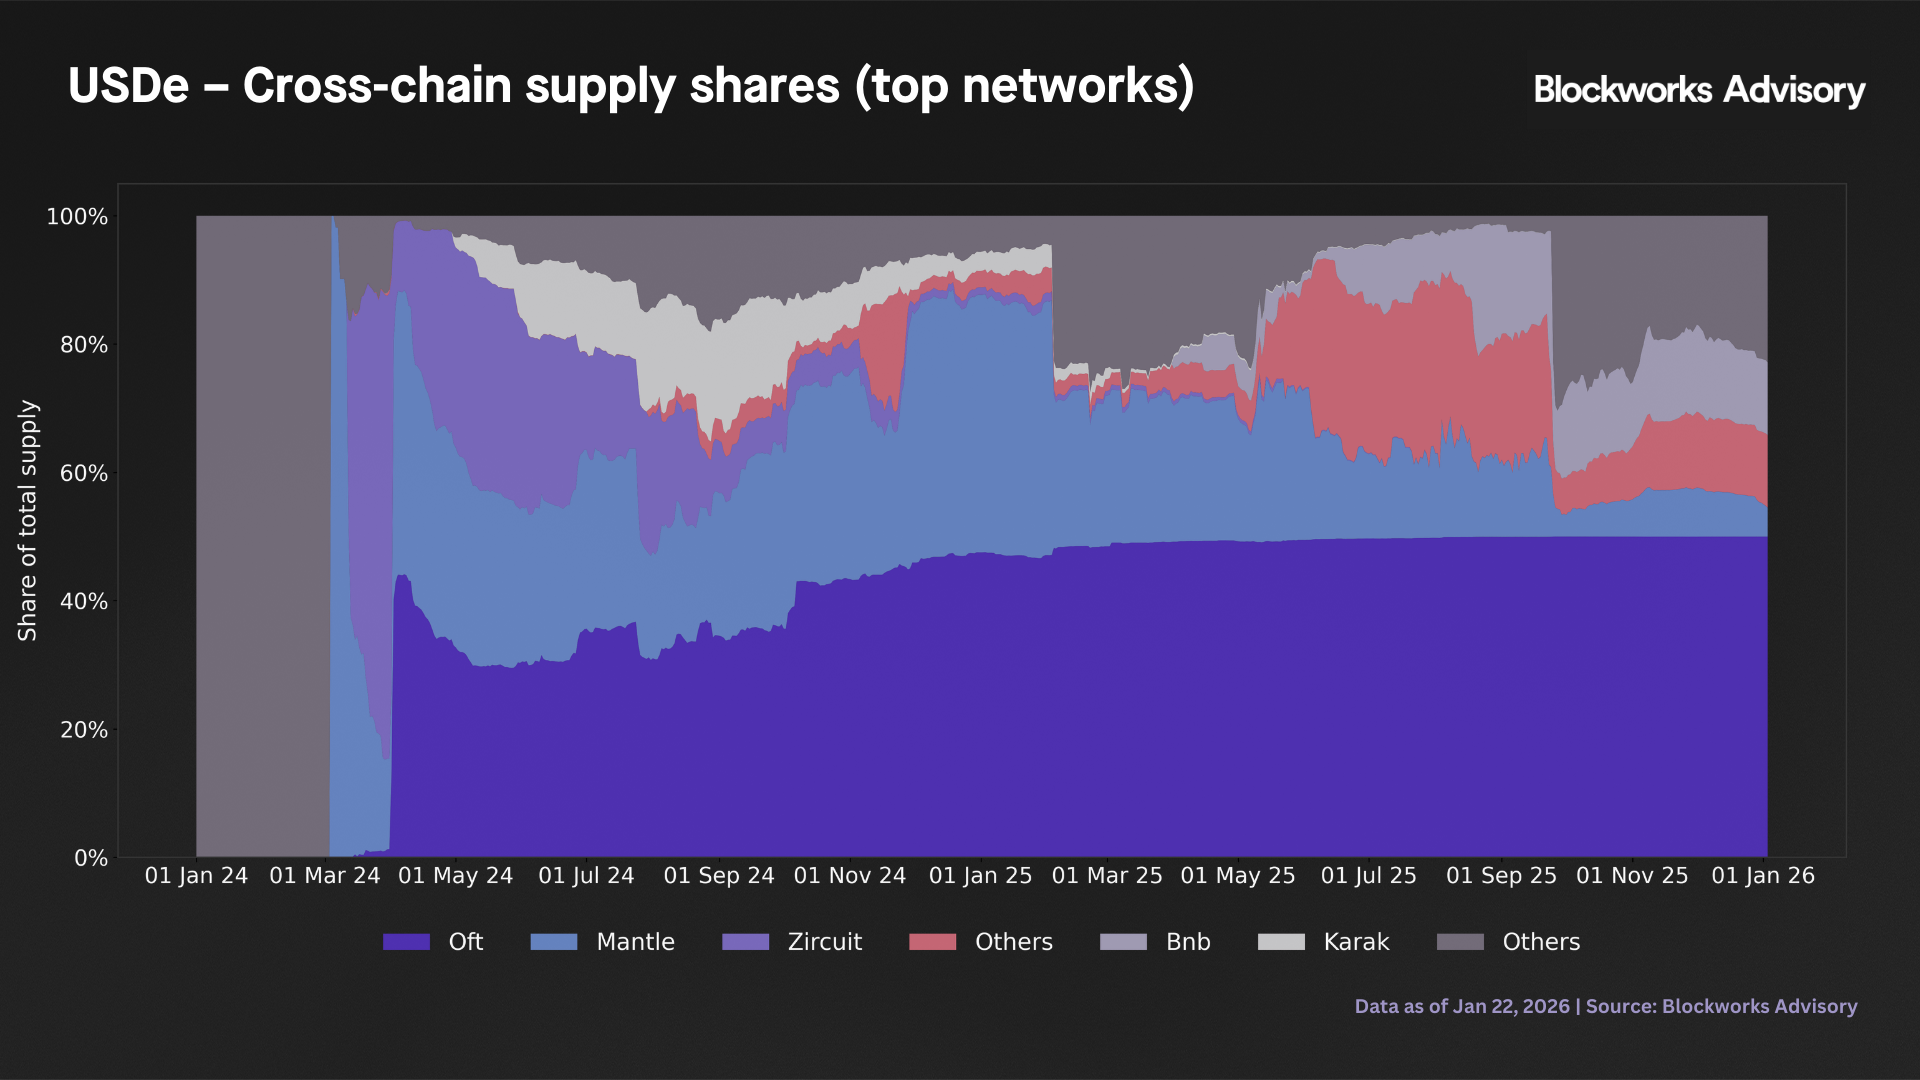
Step 5 shows that USDe supply is fragmented across chains and holder segments, but without evidence of a sharp new concentration during the October 2025 stress window. On the cross-chain side, USDe is anchored on three main network groupings. The largest bucket is the aggregate OFT L2 segment (Arbitrum, Base, Bera, Blast, BNB, HyperEVM, Mantle, Plasma), which on average holds 42.2% of circulating supply, with a relatively tight 5th - 95th percentile range of 29.5% - 50.0%. Mantle (native deployment) represents a further 22.7% on average (5th - 95th percentile of 5.4% - 40.2%), while Zircuit is smaller and more volatile, with a mean share of 7.9% and a wide upper tail (95th percentile 32.8%). During the 10 - 11 October 2025 stress window, these shares shift in composition but not in a way that creates a new single chain dominance. The OFT bucket moves to the top of its historical band at 50.0% (vs 42.2% on normal days), while Mantle and Zircuit are temporarily underweight at 4.5% and 0.01%, respectively (vs 22.8% and 7.9% in normal periods). In other words, stress coincides with a rebalancing away from some satellite deployments into the OFT umbrella, rather than a wholesale migration into a new venue. The overall dispersion across chains remains high and USDe continues to be distributed across a broad set of L2s.
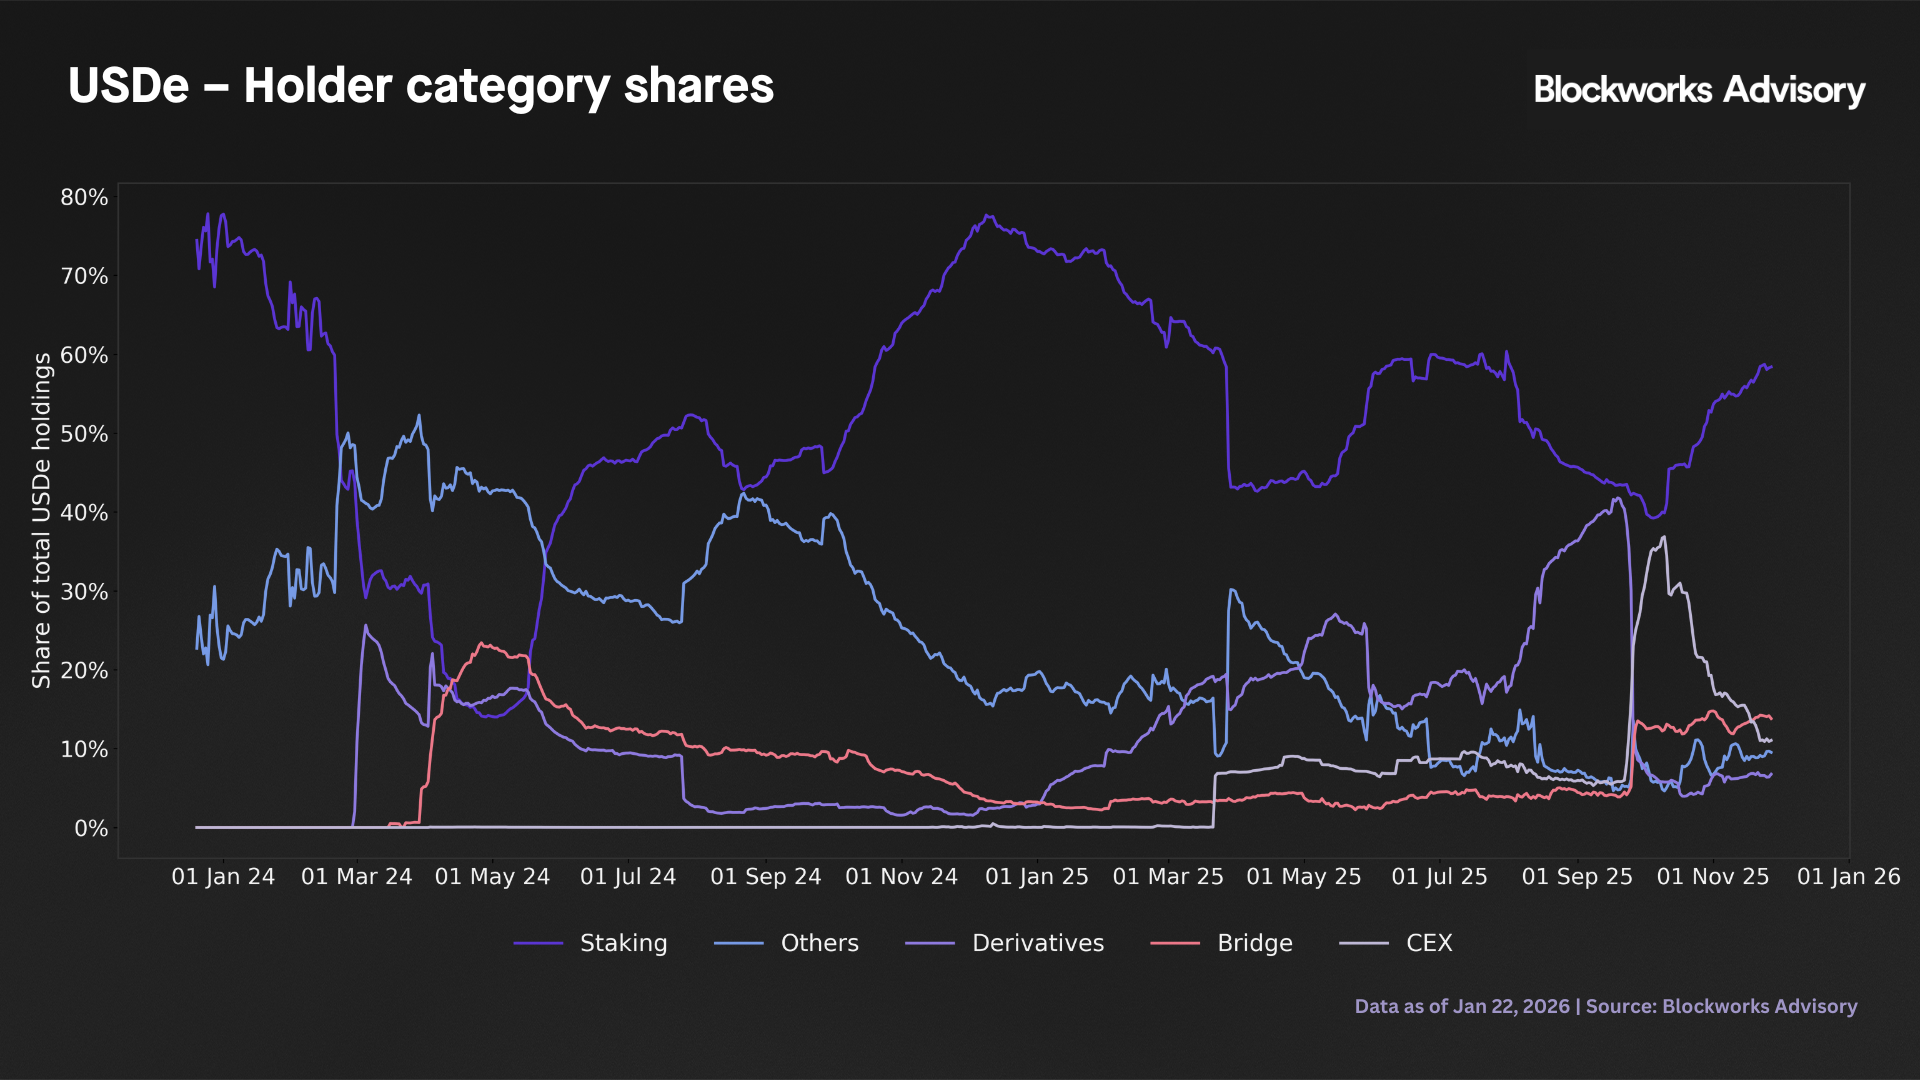
On Ethereum, labelled holder categories confirm that USDe is primarily used in staking type strategies over the full sample, but the stress window shows a temporary tilt towards centralized and bridge venues. Across the sample, "Staking" addresses hold on average 52.1% of Ethereum side USDe, with interquartile variation but consistently forming the single largest bucket (median top-1 share around 50%). "Others" (residual/unlabeled contracts and wallets) represent a further 23.7% on average, while "Derivatives" accounts for 11.5%, with a long right tail up to roughly 42%. In the October 2025 stress window, however, the staking share declined to about 40.5% (vs 52.1% in normal days), "Others" dropped to 4.8% (vs 23.8%), and "Derivatives" fell to 5.8% (vs 11.5%). At the same time, CEX labelled addresses expand sharply to roughly 35.7% of balances in stress (vs around 3.9% in normal periods), and bridge labelled addresses roughly double their share (12.8% vs 6.8%). DEX labelled balances remain small and even edge down slightly in stress (0.5% vs 1.8% in normal periods). Taken together, this suggests that stress did not trigger a disorderly unwind of staking exposures, but it did coincide with a partial migration of USDe back onto centralized exchange and bridge infrastructure and a compression of residual/unlabeled holdings.
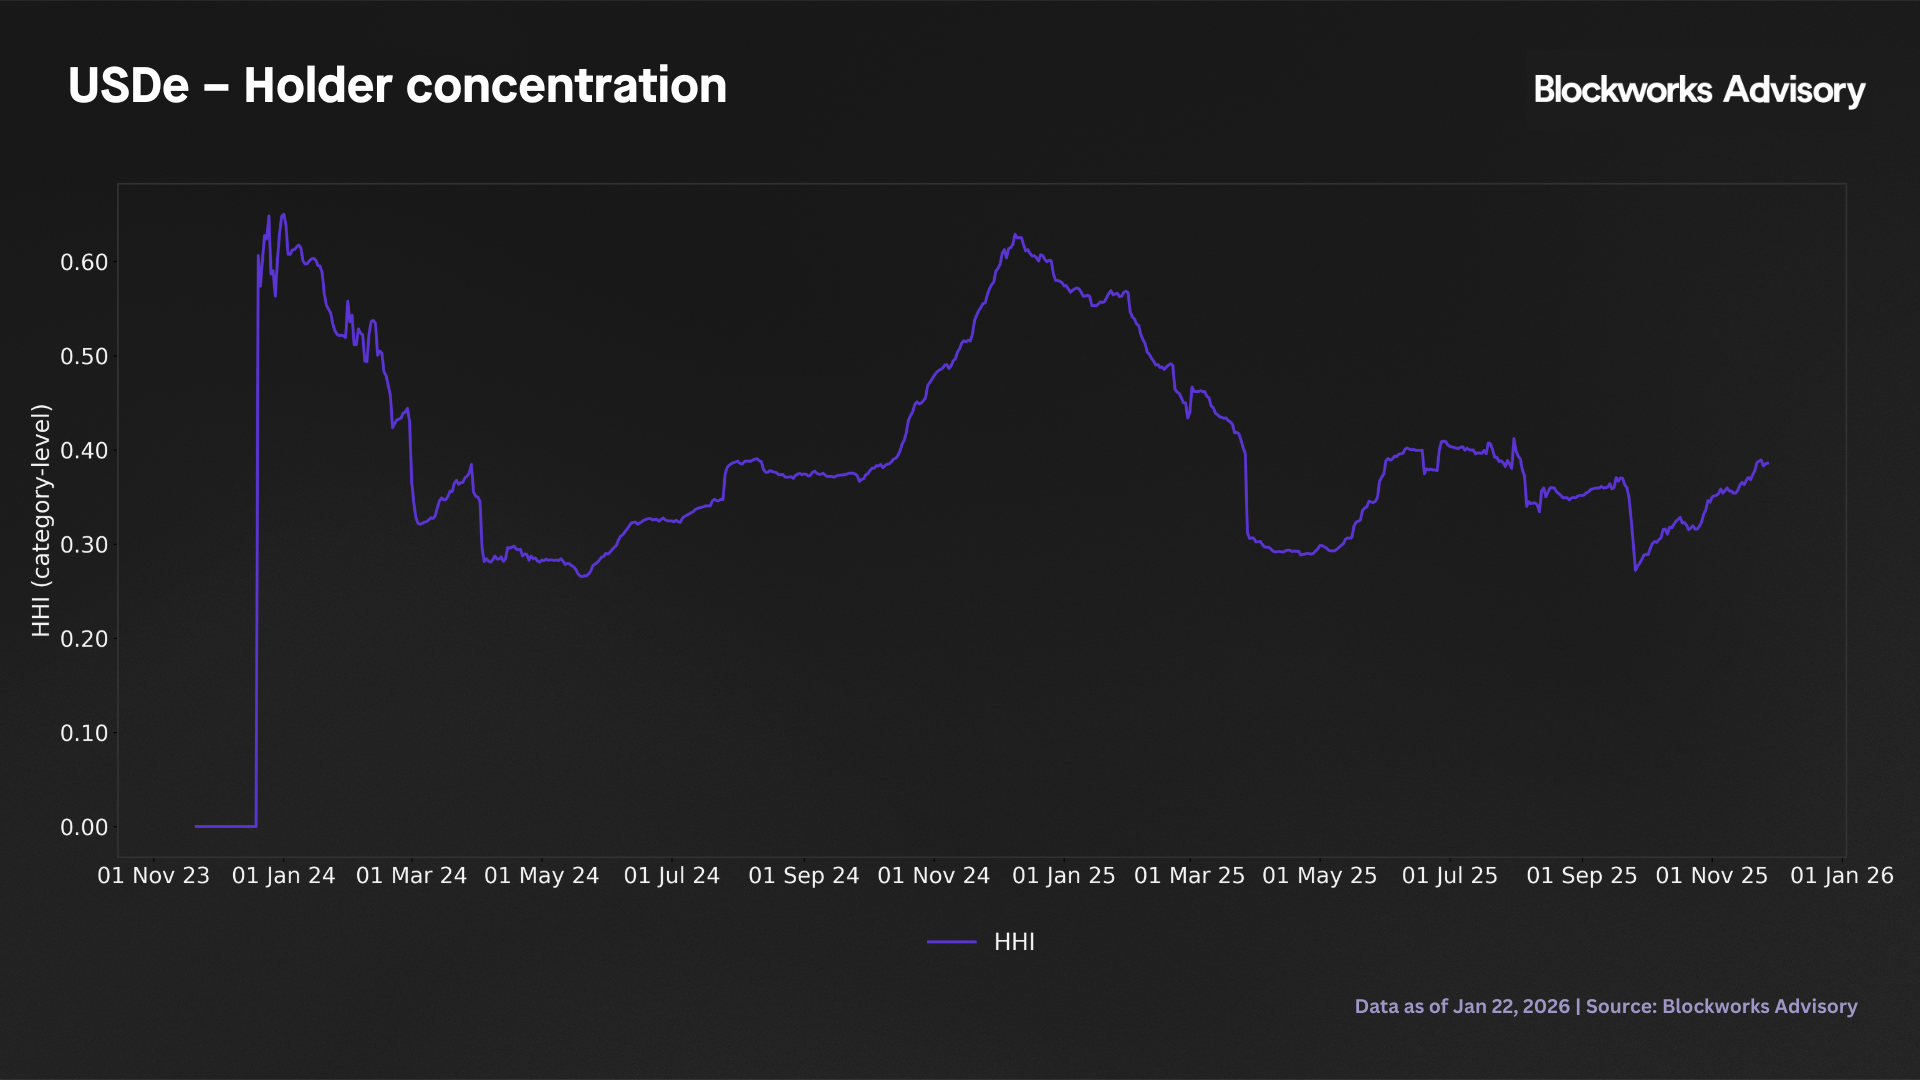
Standard concentration metrics continue to indicate a moderate but structurally elevated degree of holder concentration, without a spike during the stress window. The Herfindahl-Hirschman Index (HHI) for holder categories averages 0.39 (median 0.37) over the sample, with a 5th - 95th percentile range of roughly 0.27 - 0.60. The top-1 category share averages 52.4% and the top-3 share about 87.8%, indicating that a small number of functional segments (staking, others, and derivatives) consistently hold the majority of the supply. In stress, if anything, concentration eases slightly. Mean HHI is around 0.31 versus 0.39 in normal periods, and the top-1 share in stress (40.5%) is materially lower than the normal period average, even though the top-3 share remains very high at roughly 89%, in line with the rest of the sample. There is no sign in these data of a sudden collapse of balances into a single dominant category during the October 2025 episode.
At a coarser grouping level, the "retail/other" bucket (which, by construction, includes unlabeled smart contracts and entities not matched by CEX/DeFi/pro heuristics) accounts on average for 96.0% of observed balances over the full sample, with the 5th percentile still above 81%, while CEX labelled addresses represent about 4.0% on average. During the stress window, this relationship temporarily compresses. The retail/other share falls to roughly 64.3% and the CEX share rises to around 35.7%, consistent with the category level evidence that stress episodes induce a re-centralization of a portion of the supply onto exchange and bridge rails.
From a risk perspective, these findings imply that (i) redemption pressure is likely to be sourced primarily from a few core venues (the OFT based L2 segment plus the Mantle ecosystem) but that stress conditions are associated more with rebalancing within this set than with a new single chain concentration, (ii) within Ethereum, staking driven use cases structurally dominate in normal times, but the October 2025 window shows that a meaningful fraction of balances can migrate back to CEXs and bridge contracts when conditions tighten, and (iii) although the stress sample is only two days and should be treated as indicative, not definitive, the system currently looks diversified across OFT L2s and Ethereum, with structural dependence on onchain staking and protocol level holders, and only episodic surges in centralized exchange exposure during stress.
6. Rates, queue premium, and regressions
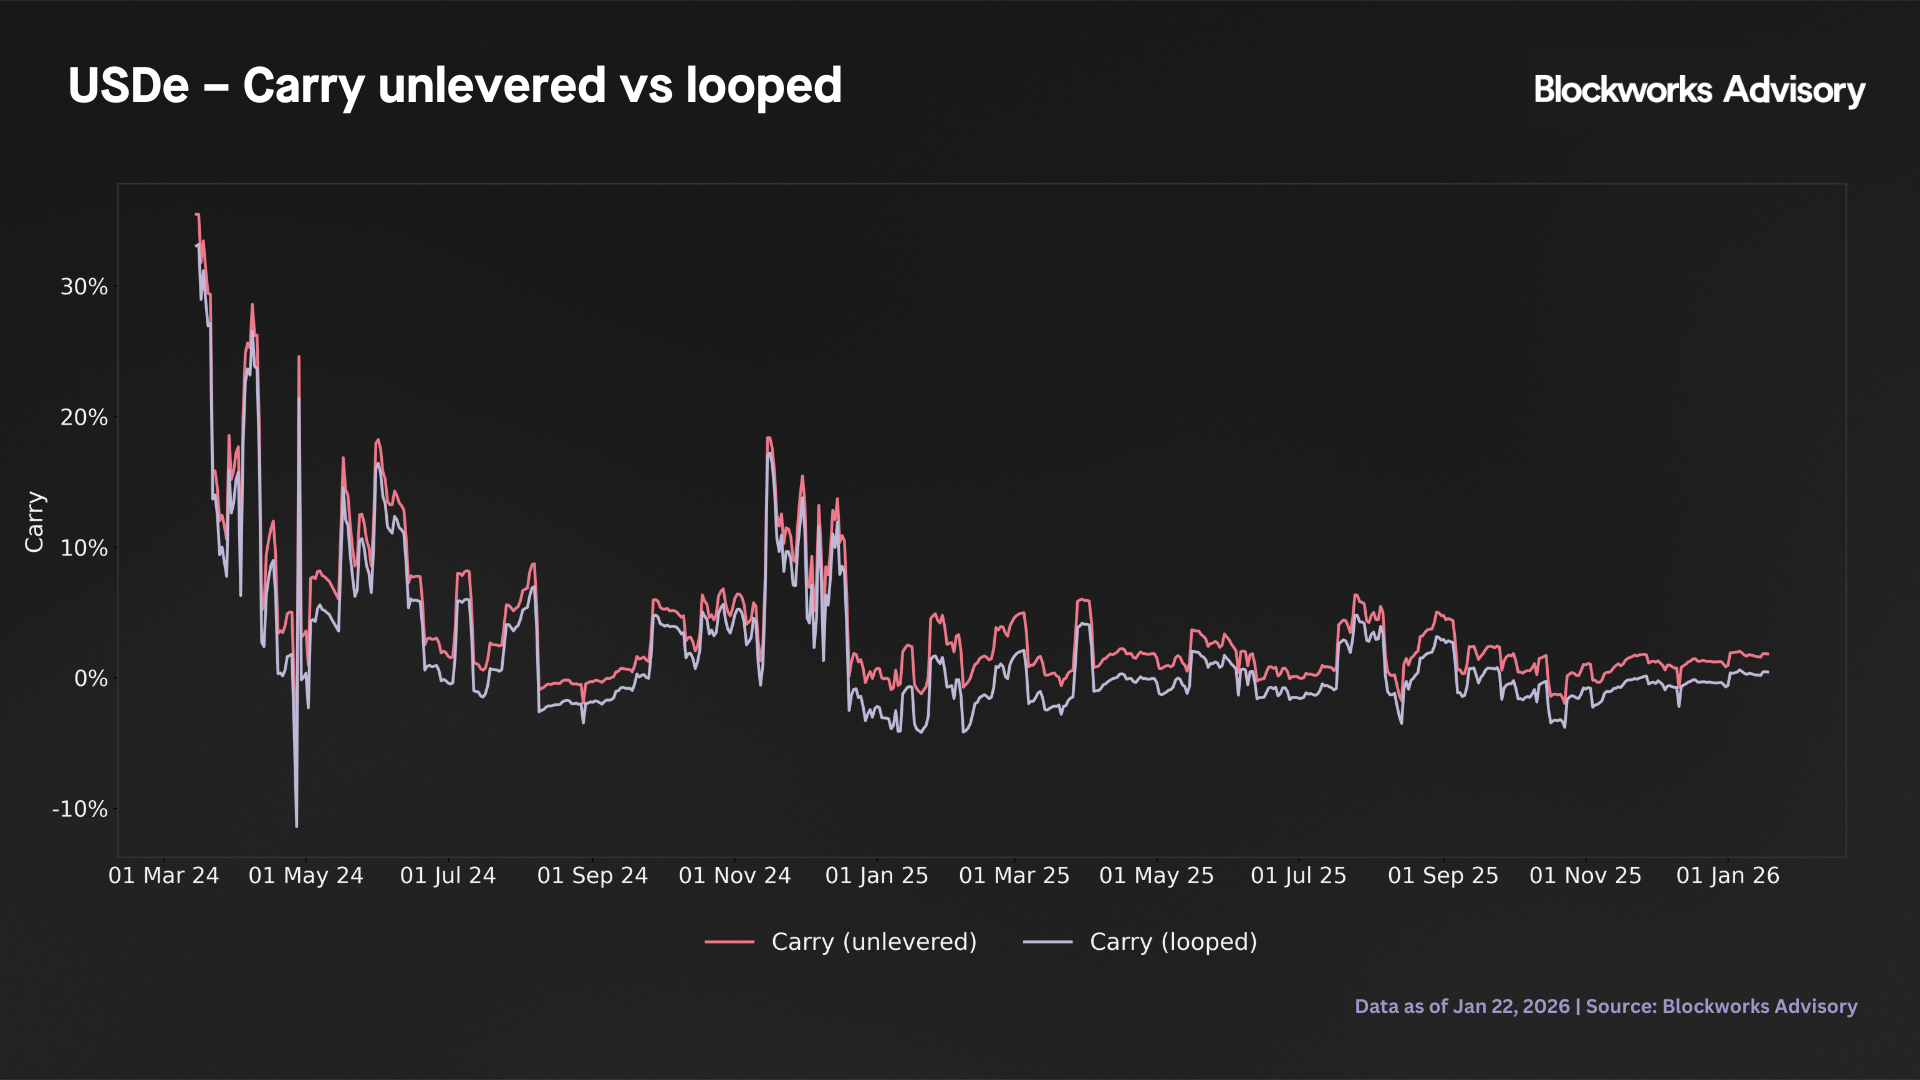
This step links the rate environment, queue design and observed behaviour in the sUSDe/USDe system via simple reduced form regressions. The starting point is the distribution of loop carry and money market spreads. The loop carry has a mean of 2.08%, but a median of only 0.17%, with a 5th - 95th percentile range from roughly -2.78% to +12.50% (n = 675). In other words, most days exhibit only modest positive or even slightly negative carry, while a relatively small number of episodes generate very high carry outliers. The underlying US dollar stablecoin market spread is much tighter and more stable, averaging about 1.63% with a median of 1.43% and a 5th - 95th percentile band of roughly 1.03% - 2.99% (n = 1,409). Thus, the funding curve consistently embeds a positive intermediation spread in favour of lenders, while the loop carry available to sUSDe loopers is volatile and often close to that spread in magnitude.
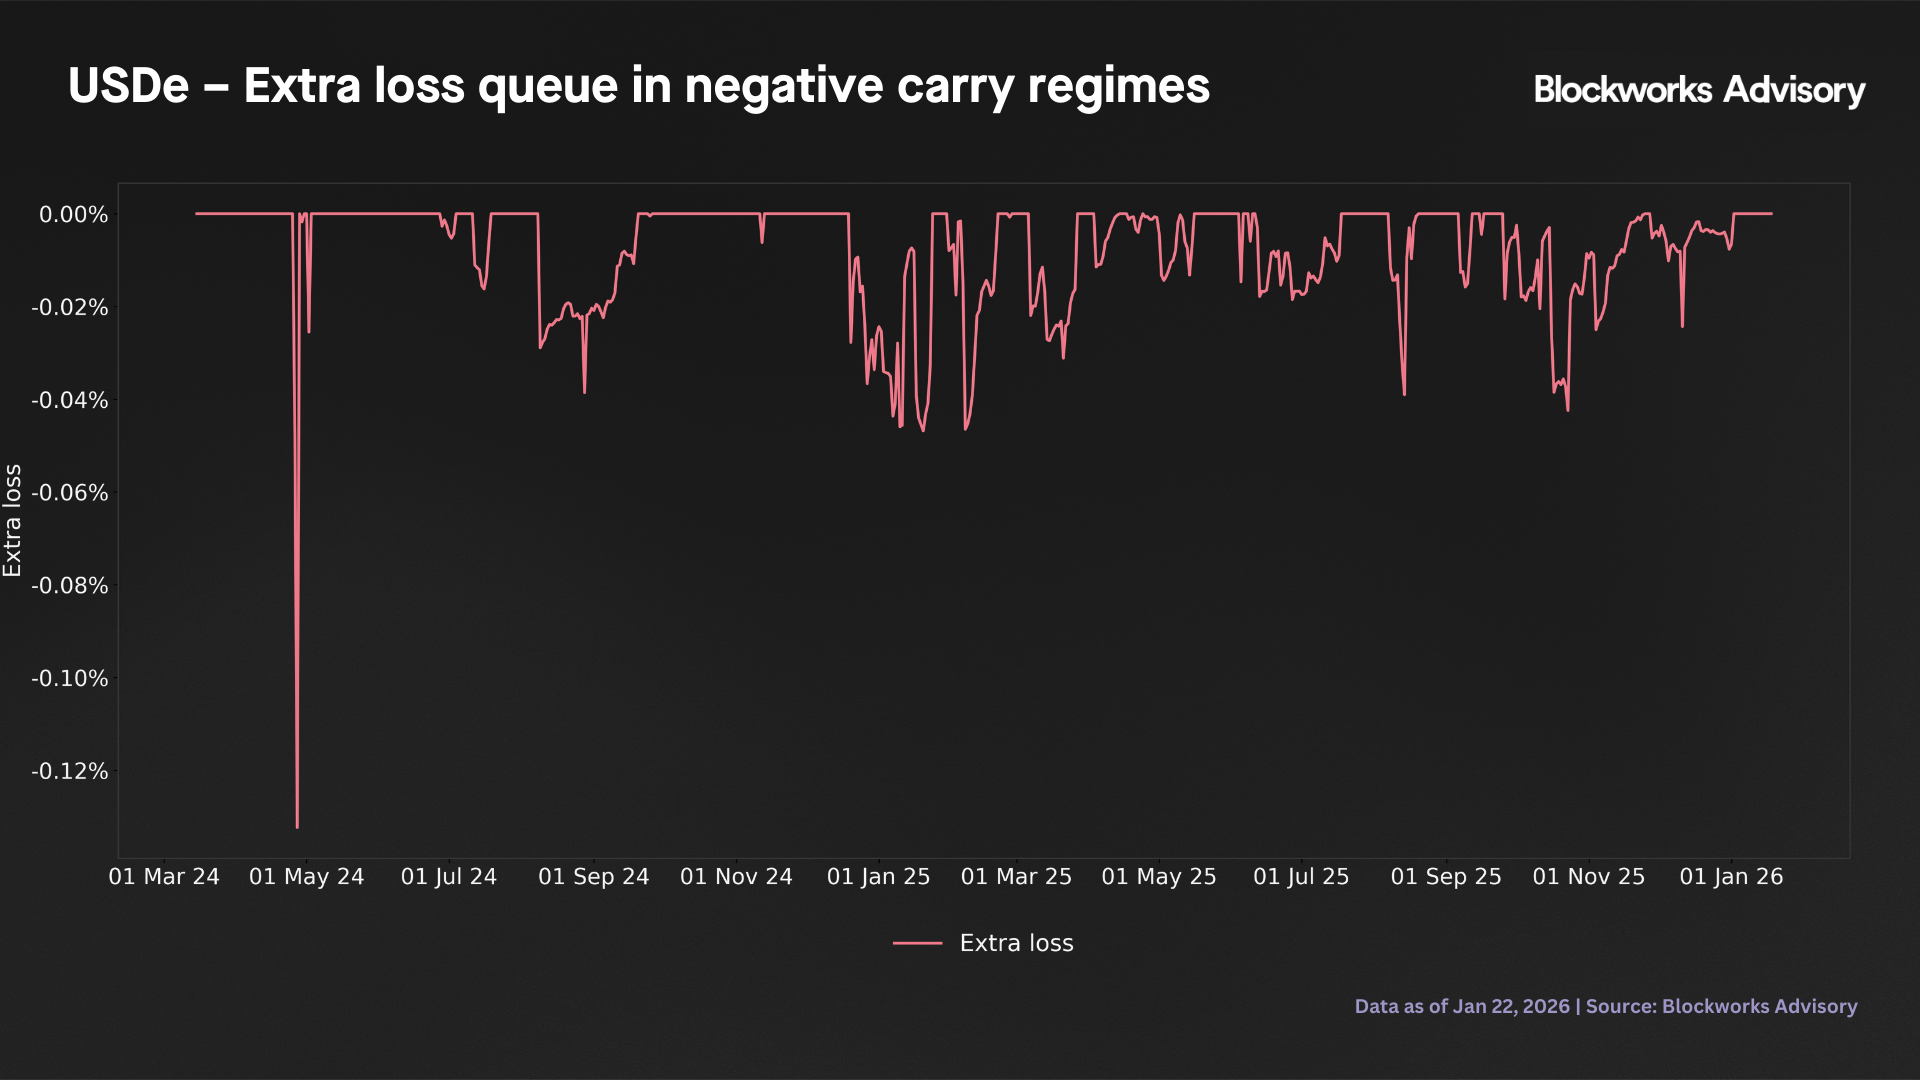
Against this backdrop, the additional expected loss from operating with a 7-day versus a 3-day queue in negative carry regimes is empirically negligible. The expected loss metric has a mean of approximately -0.007%, with a 5th percentile of -0.03% and a 95th percentile at zero (n = 675). Interpreted literally, the estimated difference in expected liquidation loss between a 7-day and a 3-day queue is on the order of less than one basis point of notional on average, with even the adverse tail realizations contained within a few basis points. Over the observed sample, the incremental expected loss from using a 7-day rather than a 3-day exit queue in negative carry regimes is small in absolute terms. The mean expected loss is about -0.007% of notional, with the 5th percentile around -0.03%. These magnitudes are one to two orders of magnitude lower than the balance sheet shocks (4 - 11% of supply), solvency buffers (1.1% overcollateralization), and carry/basis swings documented in previous sections. Within this historical regime, queue length, therefore, appears as a relatively second order driver of expected loss compared with those primary risk factors. This conclusion is conditional on the sample and should not be extrapolated to more extreme, unobserved stress scenarios.
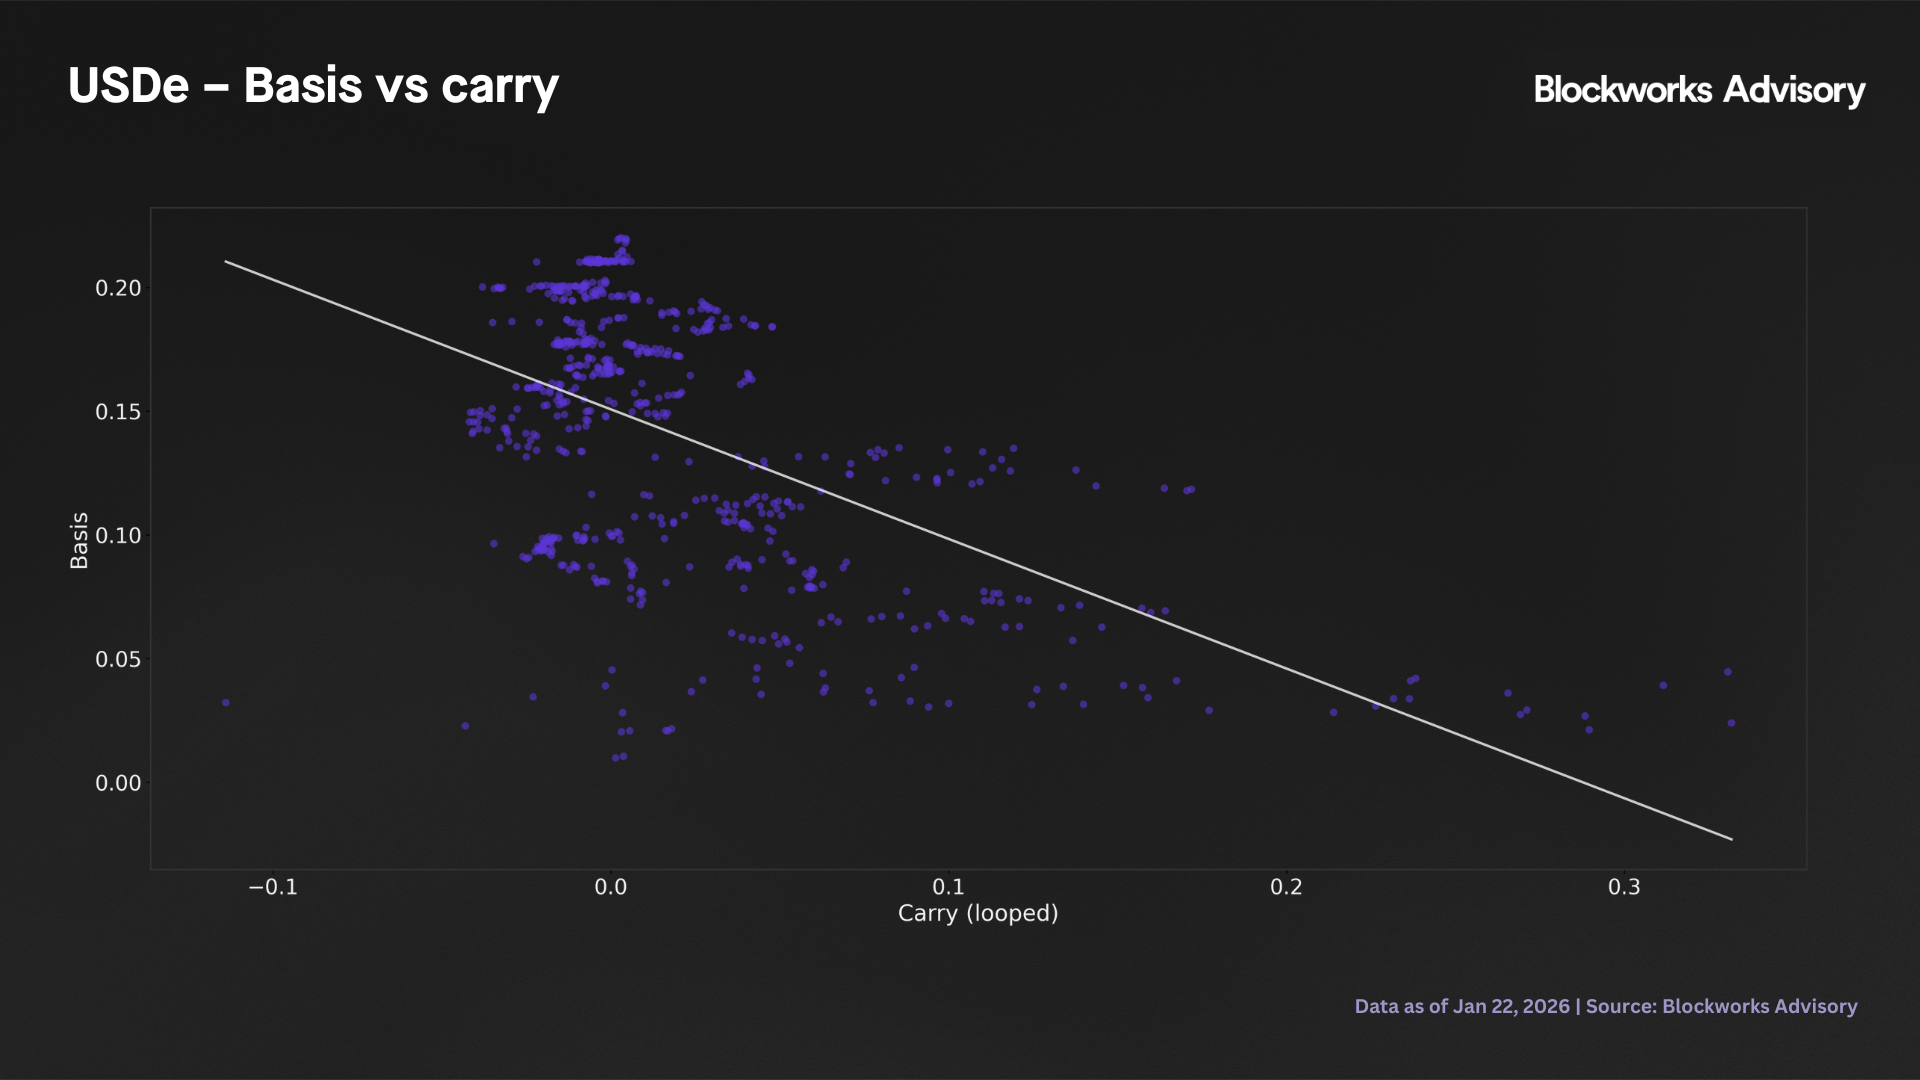
The basis regression formalizes how the sUSDe - USDe premium co-moves with loop carry and the underlying money market spread. Regressing the daily relative basis on centered loop carry and centered rate spread yields a constant of 0.140, i.e., an unconditional premium of roughly 14.0%, a negative coefficient of -0.524 on loop carry (z = -9.18, p < 0.001) and a negative coefficient of -2.72 on the rate spread (z ≈ -3.95, p < 0.001), with an adjusted R2 of about 37.6% (n = 675). Interpreted in economic terms, days where loop carry is 10 percentage points above its mean are associated with a decline in the relative basis of roughly 5.2 percentage points. This inverse relationship suggests that elevated carry environments (which typically coincide with high protocol yields and wider funding spreads) are associated with compressed wrapper premia, possibly because high yields attract direct USDe staking or because carry spikes occur during stress episodes when investors prefer to hold the underlying asset. Conversely, wider borrow - supply spreads, which make leverage more expensive, are also associated with a tighter basis. Both effects are statistically significant and economically meaningful. The adjusted R2 of 37.6% indicates that carry and spread dynamics explain a substantial portion of the day to day variation in the premium, though the majority of basis movements remain driven by other factors such as flow shocks, funding conditions on external venues or changes in perceived protocol risk. The use of HAC robust standard errors ensures that the reported significance is not driven solely by serial correlation.
The flow regression connects rate incentives and the basis to actual net primary market activity. Here, the dependent variable is the level of net USDe deposits in dollars regressed on loop carry and the relative basis. The fitted model has an adjusted R2 of around 68.1% (n = 675), with a positive but statistically insignificant coefficient on loop carry of about 485,000,000 (z ≈ 0.46, p ≈ 0.648) and a large, highly significant positive coefficient on the basis of roughly 25,430,000,000 (z ≈ 15.90, p < 0.001). Both regressors enter in decimal form (so 10 percentage points correspond to 0.10), which implies that a 0.10 increase in loop carry maps into an expected change in net deposits of 485,000,000 0.10 = +48.5m USD, though this effect is not statistically distinguishable from zero. By contrast, a 0.10 widening of the sUSDe - USDe premium maps into 25,430,000,000 0.10 = +2,543m USD (or +2.5bn USD), and this relationship is extremely robust. Put differently, in the historical data flows are overwhelmingly aligned with the visible secondary market premium rather than with the carry available from looping. The lack of statistical significance on the carry term should not be read as evidence that carry is irrelevant in all contexts, but rather that, conditional on the basis, the incremental explanatory power of carry for same day deposit flows is minimal. The very strong positive relationship between basis and flows (coefficient of 25.4 billion, z-statistic of 15.90) confirms the pattern documented in earlier sections which is that wide premia attract large capital inflows, either because investors chase elevated returns or because high premia signal strong underlying demand. Again, the use of HAC robust standard errors ensures that the reported significance levels are not influenced by serial correlation. The high adjusted R2 of 68.1% underlines that basis dynamics are the dominant driver of observed deposit behaviour, though this is a diagnostic correlation rather than a structural demand model. From a risk standpoint, the key message is that deposit flows are highly sensitive to basis movements, while loop carry appears to play at most a secondary role in the historical sample.
Overall, these regression results paint a consistent picture. First, loop carry opportunities are intermittent and modest on average (2.08% mean), concentrated in a relatively small number of high yield episodes rather than being a stable, low volatility annuity, so one should be cautious in extrapolating high APYs into long run economics for leveraged stakers. Second, the empirical difference in expected loss between a 3- and 7-day queue length in the observed negative carry regimes is extremely small, suggesting that queue design primarily affects liquidity management and user experience rather than expected loss in the historical range of conditions. Third, basis and carry exhibit a strong inverse relationship (higher carry lower basis), likely reflecting the fact that high carry episodes coincide with stress conditions or direct staking attractiveness that compress the wrapper premium. Fourth, flow dynamics are dominated by the basis rather than by carry. The basis alone explains 68% of net deposit variation, with a coefficient implying that a 10 percentage point widening in the premium is associated with an additional +2.5bn USD of inflows. By contrast, loop carry has no statistically significant direct effect on flows once the basis is controlled for. This suggests that investors respond primarily to the visible market price signal (the sUSDe/USDe premium) rather than to the calculated return from leverage loops. In practice, robust risk management around USDe and sUSDe loops should recognize that basis movements are the primary driver of deposit volatility and redemption pressure, and that stress scenarios featuring sharp basis compression (or negative premia) are likely to trigger large scale outflows. Queue length and carry dynamics matter but appear secondary. Risk limits and stress tests should be calibrated with particular attention to basis shocks, which empirically dominate flow behaviour and have substantial explanatory power in this reduced form framework.
7. Dynamic cooldown analysis
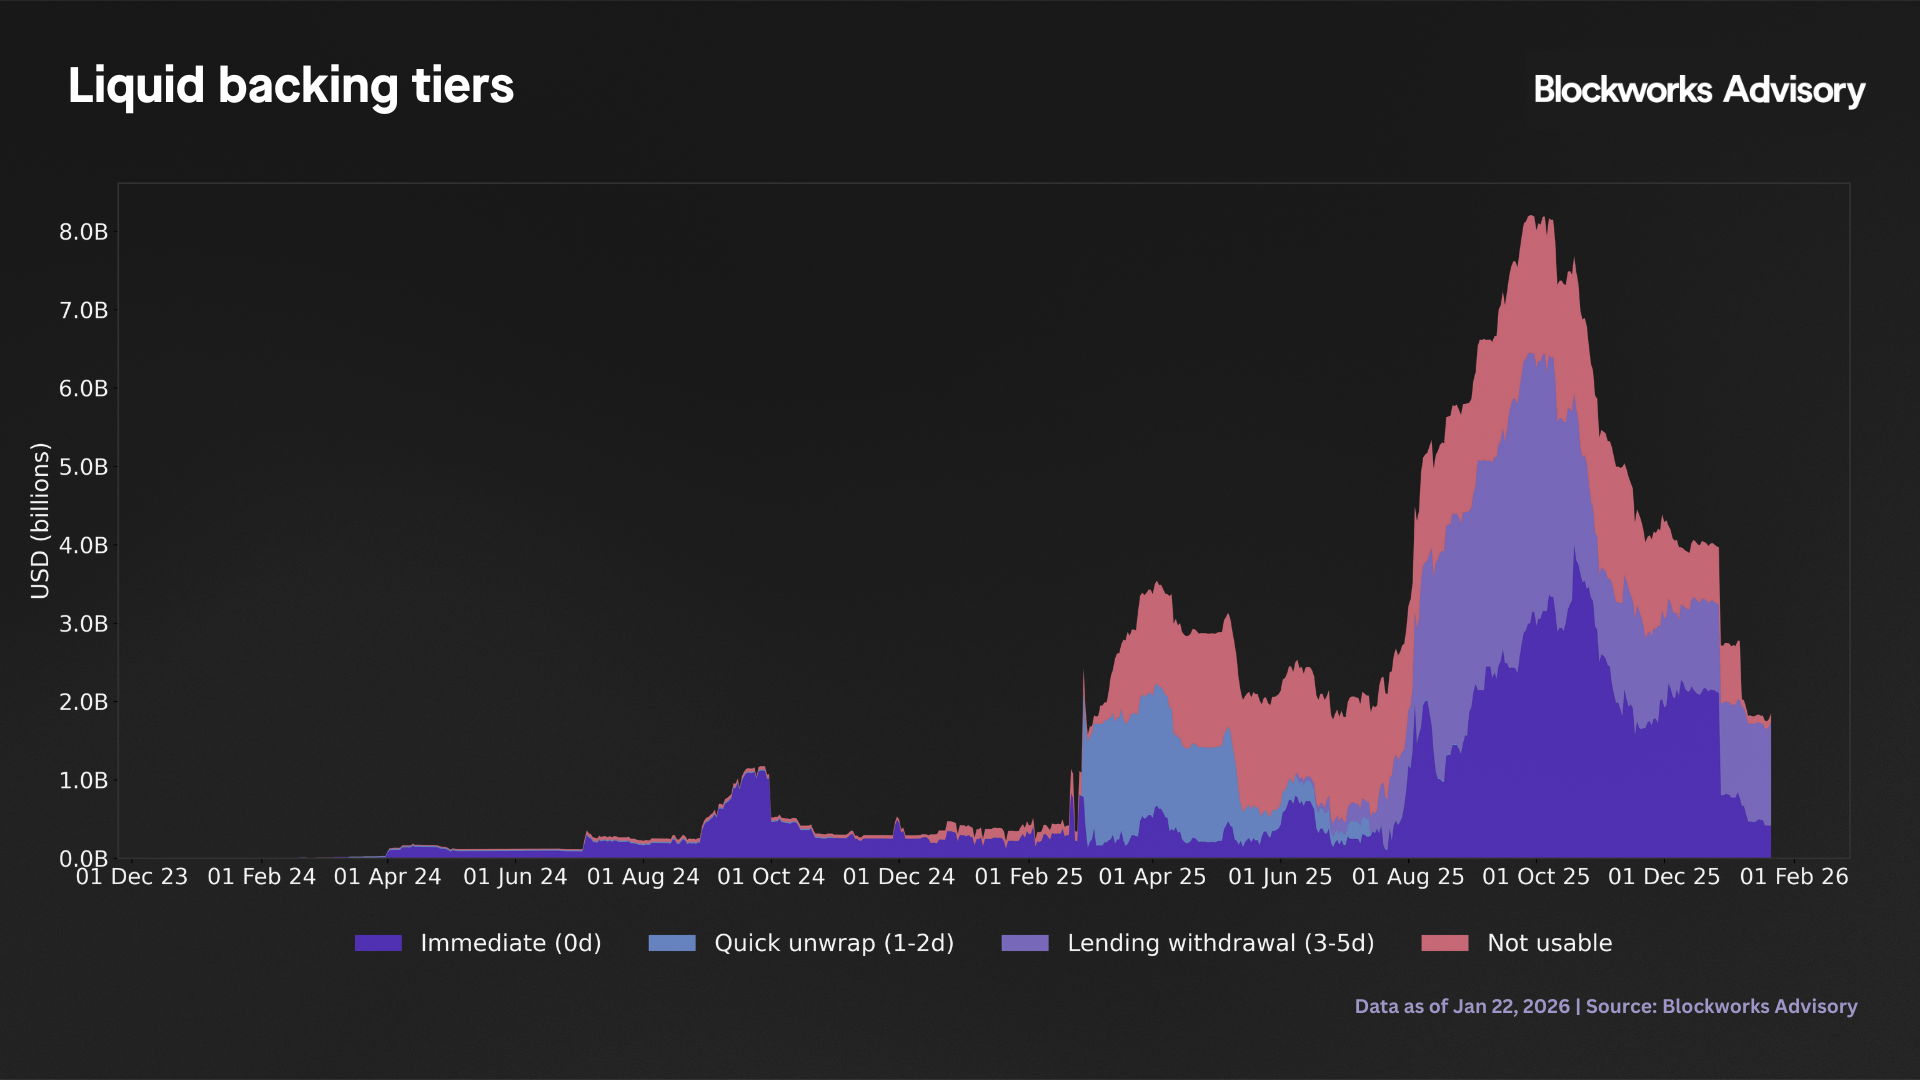
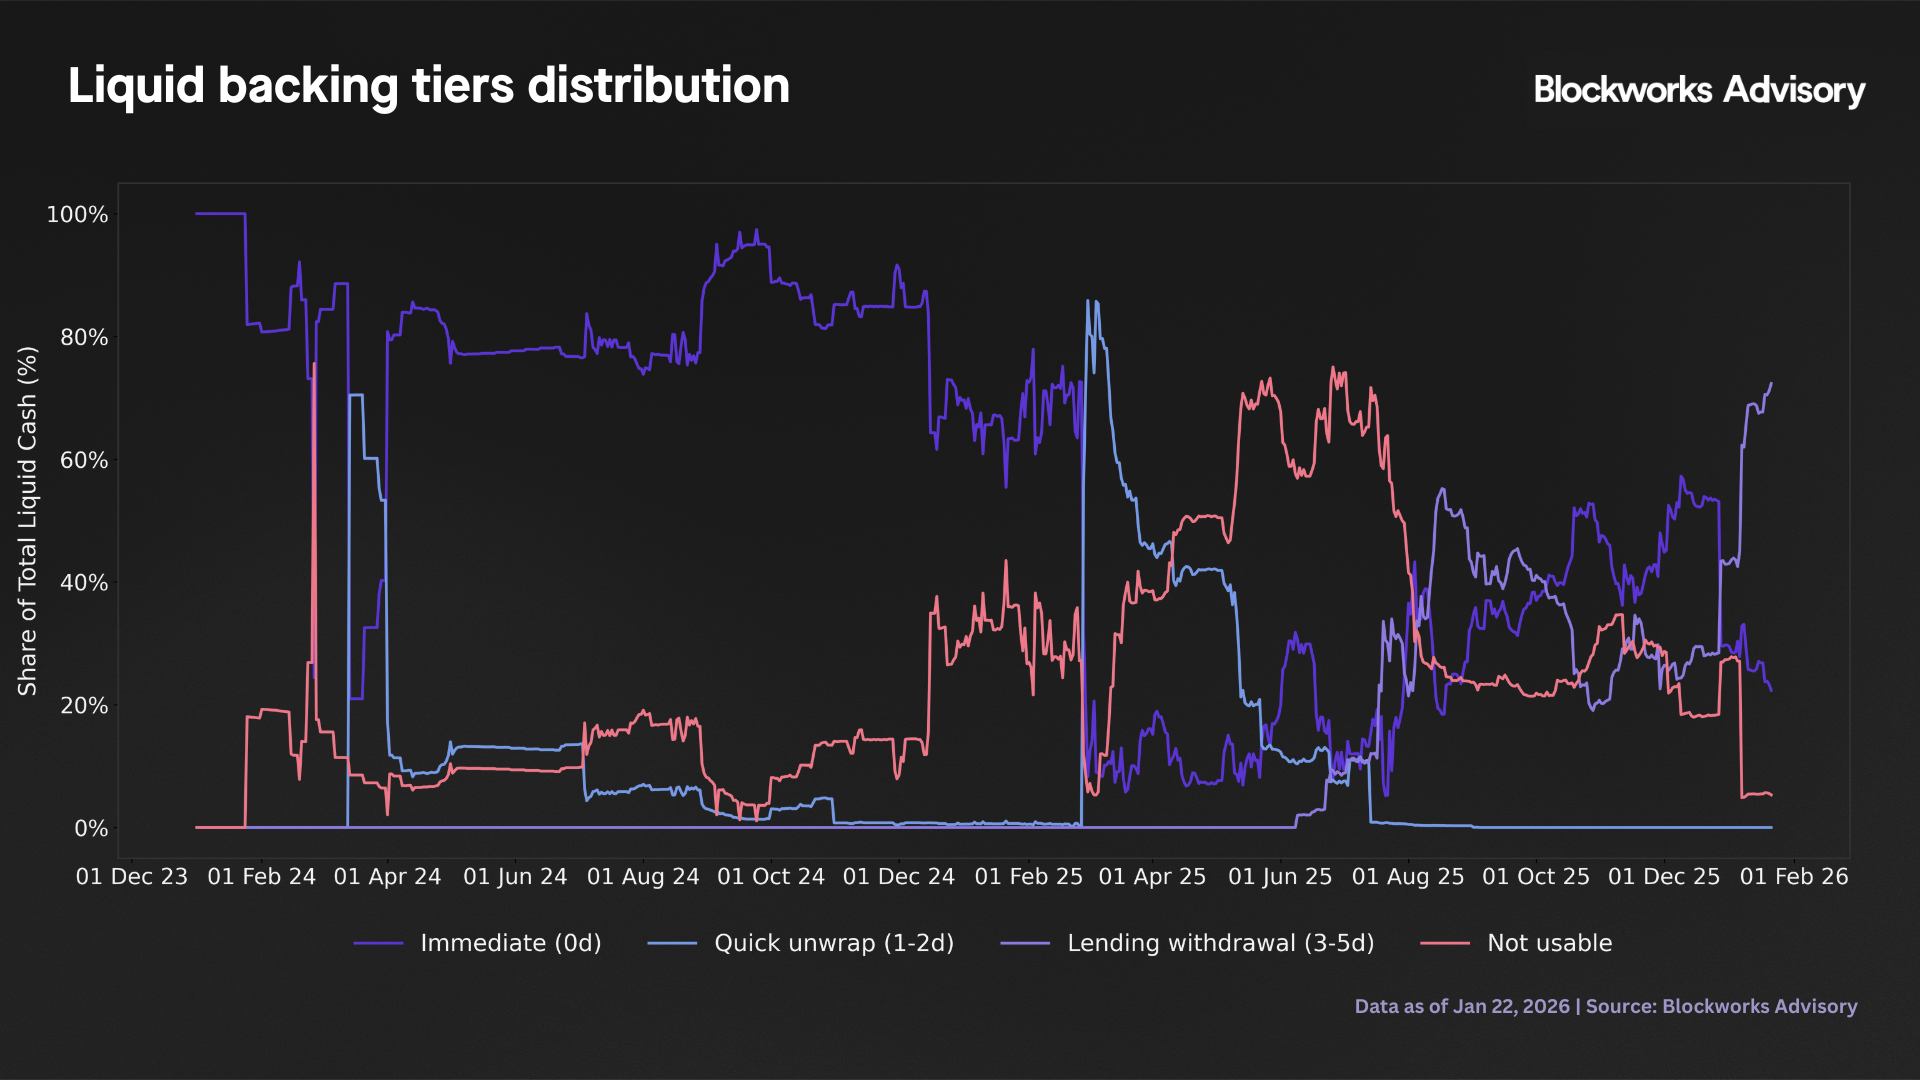
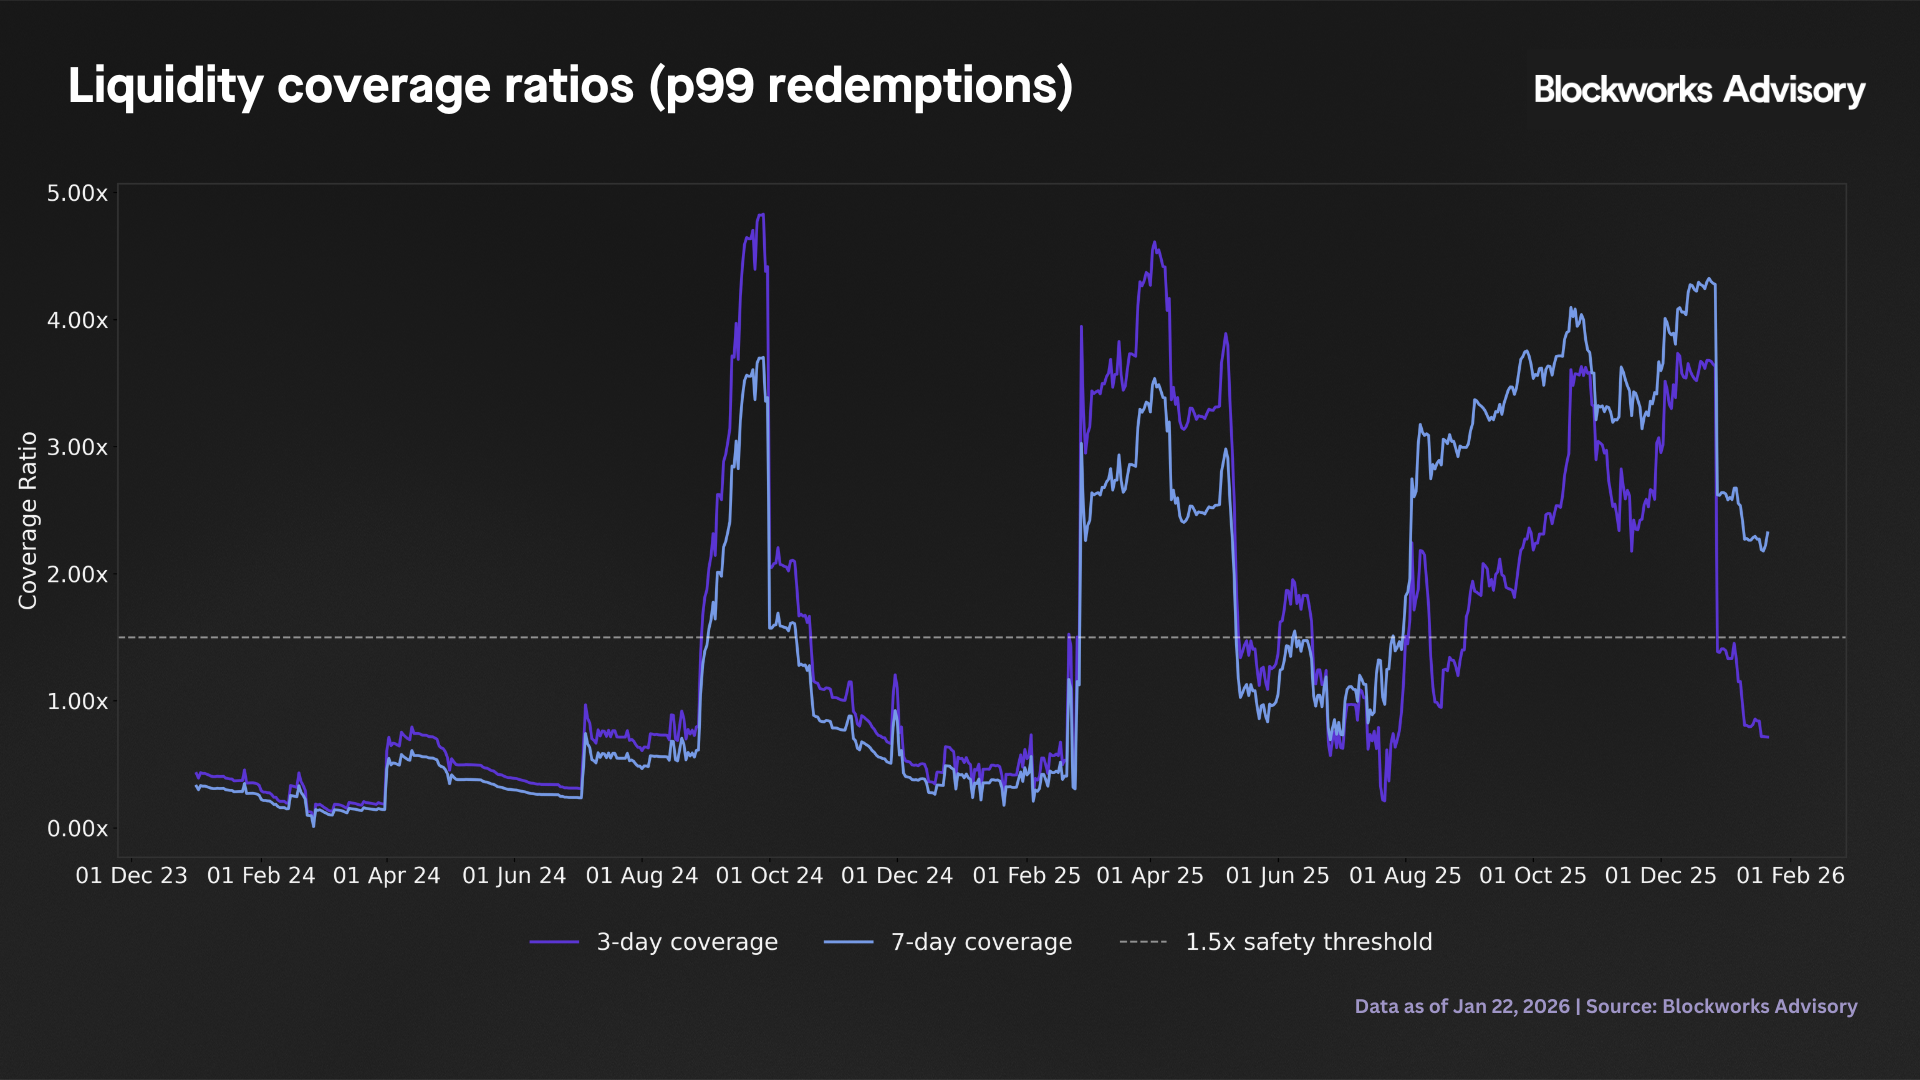
This final step applies a simple dynamic cooldown framework to evaluate whether the historical distribution of USDe onchain liquid backing would have supported shorter redemption windows under stress tested flow assumptions. The methodology embeds a 1.5× safety factor and calibrates expected redemptions against the 99th percentile of observed daily, 3-day, and 7-day outflows from the queue analysis (approximately 4.1%, 9.2%, and 12.0% of circulating supply, respectively). Liquid backing is classified into four settlement speed tiers based on asset type and venue, with Tier 1 representing immediately redeemable cash (primarily stablecoin balances on centralized exchanges), Tier 2 capturing assets redeemable within two business days, Tier 3 covering those accessible within five days, and Tier 4 representing all other backing that requires longer settlement or conversion cycles. The framework then evaluates, for each day in the sample, whether the usable liquid cash (defined as the sum of Tiers 1 through 3) exceeds 1.5× the p99 redemption benchmark for a given cooldown length, and recommends the shortest cooldown period that satisfies this coverage threshold, subject to a 7-day cap.
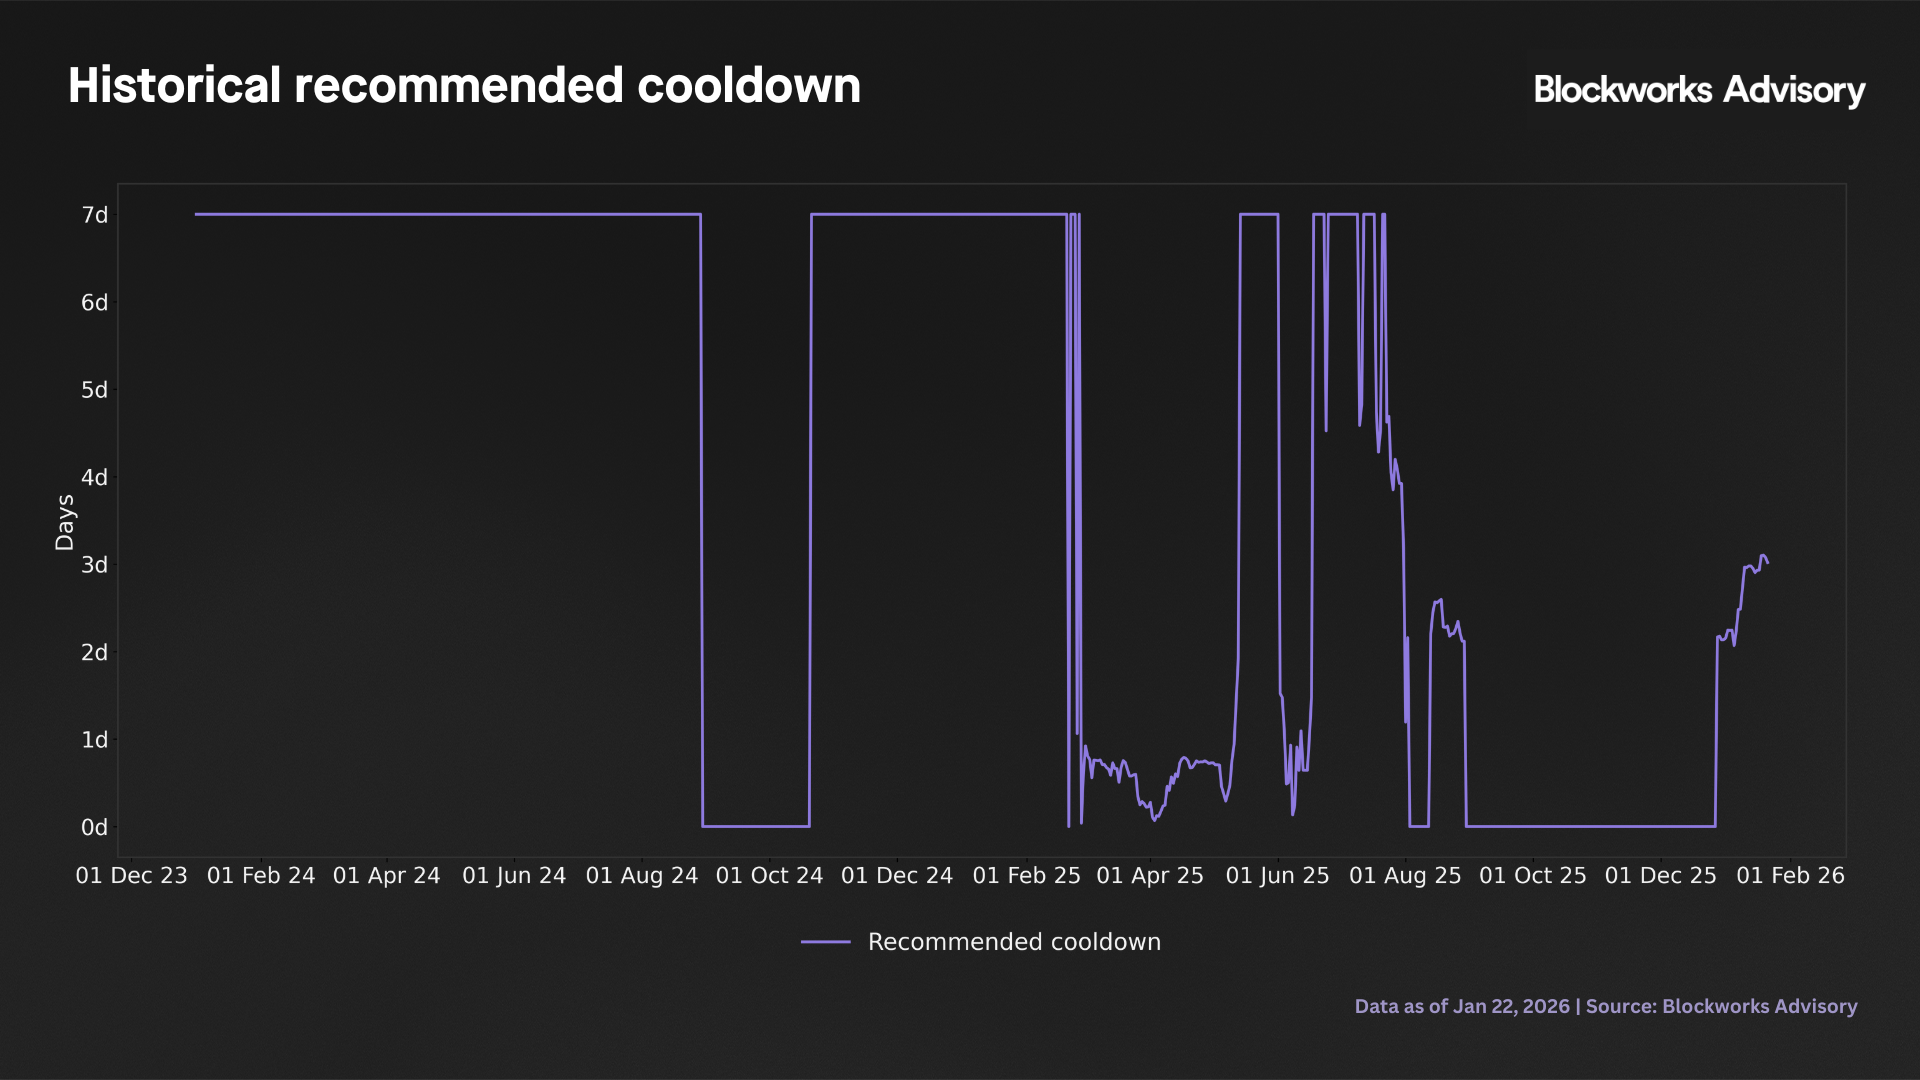
Over the full sample of 752 days, the modal recommended cooldown is 7 days, and the system would have required the full 7-day window on 55.5% of days (417 days). By contrast, zero days in the sample achieve the coverage threshold necessary to support a 3-day cooldown under the 1.5× safety factor and p99 flow assumptions. This reflects the structural thinness of the immediately available liquid backing relative to the tail redemption scenarios embedded in the stress test. The underlying coverage ratios confirm this characterization. For the 3-day redemption window, usable liquidity averages 1.48× the required buffer (median 0.89×), with a 5th percentile at 0.20× and a 95th percentile at 3.73×. In other words, on a typical day the protocol holds less than the 1.5× coverage target for a 3-day queue, and even the upper tail of the distribution barely exceeds 2× coverage. The 7-day coverage ratios are only slightly higher, averaging 1.52× (median 0.89×), with a minimum over the sample of 0.01× and a 95th percentile of 3.75×. These statistics indicate that while liquid backing is non-trivial in absolute terms (averaging roughly $666 million immediately available, $831 million within two days, and $1,294 million within five days), the combination of elevated tail redemption risk (p99 scenarios up to 12% of supply) and the 1.5× safety margin leaves little room for shorter cooldowns in the historical regime.
The time series exhibits 163 regime changes over the 752-day window, underscoring that recommended cooldown length is not static but varies materially with fluctuations in both USDe supply and the composition of backing assets. In practice, this volatility in recommended cooldown implies that any attempt to implement a shorter fixed redemption window (for example, moving from 7 days to 3 days universally) would expose the system to coverage shortfalls on more than half of observed days, conditional on the p99 flow benchmarks and 1.5× safety factor used in this framework.
A comparison of the 10 - 11 October 2025 stress window against the 750 normal days reveals a counterintuitive pattern. During the stress episode, the average recommended cooldown drops to 0 days, meaning that liquid backing was sufficient to cover even the most aggressive p99 redemption scenarios with the 1.5× safety buffer intact. This is driven by sharply elevated coverage ratios in the stress window. The 3-day coverage averages 2.43× in stress (minimum 2.39×), compared with 1.47× in normal periods (minimum 0.01×). Similarly, the 7-day coverage averages 3.60× in stress (minimum 3.56×) versus 1.52× under normal conditions (minimum 0.01×). In effect, during the October 2025 episode, the protocol's liquid backing (measured relative to the tail redemption benchmarks) was substantially stronger than in the baseline regime, notwithstanding the fact that the stress window coincided with large queue outflows and supply contractions documented in earlier sections.
This apparent paradox likely reflects a combination of two factors. First, the stress event may have triggered a precautionary increase in immediately liquid asset holdings (for instance, rebalancing backing into Tier 1 stablecoins or migrating collateral to more liquid venues), thereby improving the usable liquidity numerator even as total supply contracted. Second, the p99 benchmarks used in the cooldown calculation are derived from the full historical sample and thus capture tail scenarios that are more extreme than the actual October 2025 realizations. If the stress episode did not reach the historical p99 redemption intensities for 3-day or 7-day windows, then the coverage ratio mechanically improves relative to those fixed benchmarks. Irrespective of the precise driver, the stress window result suggests that during the observed October 2025 event, liquidity management and backing rebalancing appear to have kept pace with or even outstripped redemption pressure, at least when measured against the p99 tail scenarios and 1.5× safety standard embedded in this framework.
From a risk and policy perspective, these findings carry several implications. First, the historical liquid backing distribution does not comfortably support a uniform shift to a 3-day cooldown under the p99 flow assumptions and 1.5× safety margin. On 55% of days, even a 7-day window would have been marginally adequate, and zero days pass the 3-day threshold. This is not an argument against shorter cooldowns in principle, but rather an indication that any move toward faster redemptions would require either (i) a structural increase in the share of Tier 1 liquid backing, (ii) acceptance of lower coverage ratios or less conservative tail scenarios, or (iii) dynamic cooldown policies that lengthen redemption windows when coverage deteriorates. Second, the 163 regime changes over two years underscore that a static cooldown choice is unlikely to align well with time varying liquidity conditions. A more sophisticated approach might involve conditional cooldown lengths that adjust in real time based on observed coverage ratios, though this introduces operational complexity and could create adverse user experience if cooldowns frequently shift. Third, the stress window improvement in coverage ratios is a reassuring signal that the system can mobilize liquidity under pressure, but it should not be overinterpreted. The October 2025 episode represents a single 2-day event, and the coverage improvement may partly reflect the fact that actual stress period redemptions did not reach the historical p99 benchmarks. Future stress scenarios featuring simultaneity of large redemptions, illiquid backing, and constrained rebalancing capacity could produce the opposite result. Finally, the absolute levels of liquid backing ($666 million immediate, $831 million within 2 days, $1,294 million within 5 days) provide a useful scale reference. These figures are substantial in dollar terms but translate to coverage ratios in the 0.9× to 1.5× range for tail redemption scenarios, implying that liquidity buffers are thin relative to the worst case flow shocks embedded in the p99 calibration. Robust risk management, therefore, requires close monitoring of both the level and composition of backing assets, with particular attention to the share held in Tier 1 (immediately liquid) form and the sensitivity of coverage ratios to supply side volatility. In scenarios where backing rebalancing lags redemption surges or where tail flow realizations exceed the p99 benchmarks, the system could face binding liquidity constraints even under a 7-day cooldown, underscoring the importance of maintaining adequate onchain liquidity and operational flexibility in collateral management.
Back to Insights
Newsletter
The Breakdown
Decoding crypto and the markets. Daily, with Byron Gilliam.
Blockworks Research
Unlock crypto's most powerful research platform.
Our research packs a punch and gives you actionable takeaways for each topic.
Blockworks Inc.
133 W 19th St., New York, NY 10011
Blockworks Network
Resources & Legal