Insights / Dashboard Primers
Aerodrome Finance: Data Dashboard Primer
The protocol is preparing a major architectural upgrade that will merge Aerodrome and Velodrome into a unified cross-chain DEX and introduce MEV internalization as a new revenue stream
By Nick Carpinito ·
Introduction
Aerodrome Finance is the dominant DEX on Base. Launched in August 2023 by Dromos Labs, the same team behind Velodrome on Optimism, the protocol was designed from inception to serve as Base's primary liquidity layer. Its product suite spans a constant-product AMM for stable and volatile asset pairs, and Slipstream, a concentrated liquidity module closely derived from Uniswap V3 that allows LPs to deploy capital within defined price ranges for improved capital efficiency.
Aerodrome's revenue model is built on swap fees and external bribes. For staked liquidity positions, fees are routed through gauges to veAERO governance token holders. Unstaked positions retain trading fees directly. The mechanism driving this is the ve(3,3) model, a design pioneered by Velodrome. Users lock AERO tokens for up to four years in exchange for veAERO, an NFT that grants governance voting rights and a direct claim on protocol revenue. veAERO holders vote each epoch to direct AERO emissions toward specific liquidity pools, creating a competitive marketplace where projects and protocols bid via direct bribes to attract liquidity. The flywheel closes when higher emissions attract more LPs, deeper liquidity generates more trading volume, and increased volume produces more fees and bribes for veAERO holders to capture.
Aerodrome holds ~$240M in TVL, with cumulative fees since launch exceeding $322M. The protocol is preparing a major architectural upgrade, Aero/MetaDEX03, targeting a Q2 2026 launch that will merge Aerodrome and Velodrome into a unified cross-chain DEX and introduce MEV internalization as a new revenue stream.
Dashboard Overview
Our Aerodrome dashboard is organized into 10 tabs spanning financial performance, token mechanics, governance activity, trading behavior, and competitive positioning.
- Financials: Protocol-level income statement data including revenue, fees, earnings, and emission costs over time.
- AERO Token: Supply dynamics, circulating vs. locked AERO, emission schedules, and price performance.
- Governance: veAERO voting participation, epoch-level gauge weight distribution, and bribe market activity.
- veNFT: Composition of the veAERO holder base including lock durations, concentration, and auto-max lock adoption.
- Spot Volume: Aggregate and pool-level trading volume, broken out by pool type.
- Order Flow: Trader-level activity including route distribution, aggregator share of volume, and flow toxicity signals.
- Traders: User growth, unique trader counts, repeat usage rates, and wallet-level behavioral segmentation.
- Liquidity: TVL composition by pool type and asset, LP concentration, and capital efficiency ratios.
- Ignition: Metrics tracking the Aero Ignition program, Aerodrome's structured liquidity bootstrapping initiative for new protocols launching on Base.
- Competitive Landscape: Market share benchmarks against peer DEXs on Base and broader L2 equivalents.
Financials
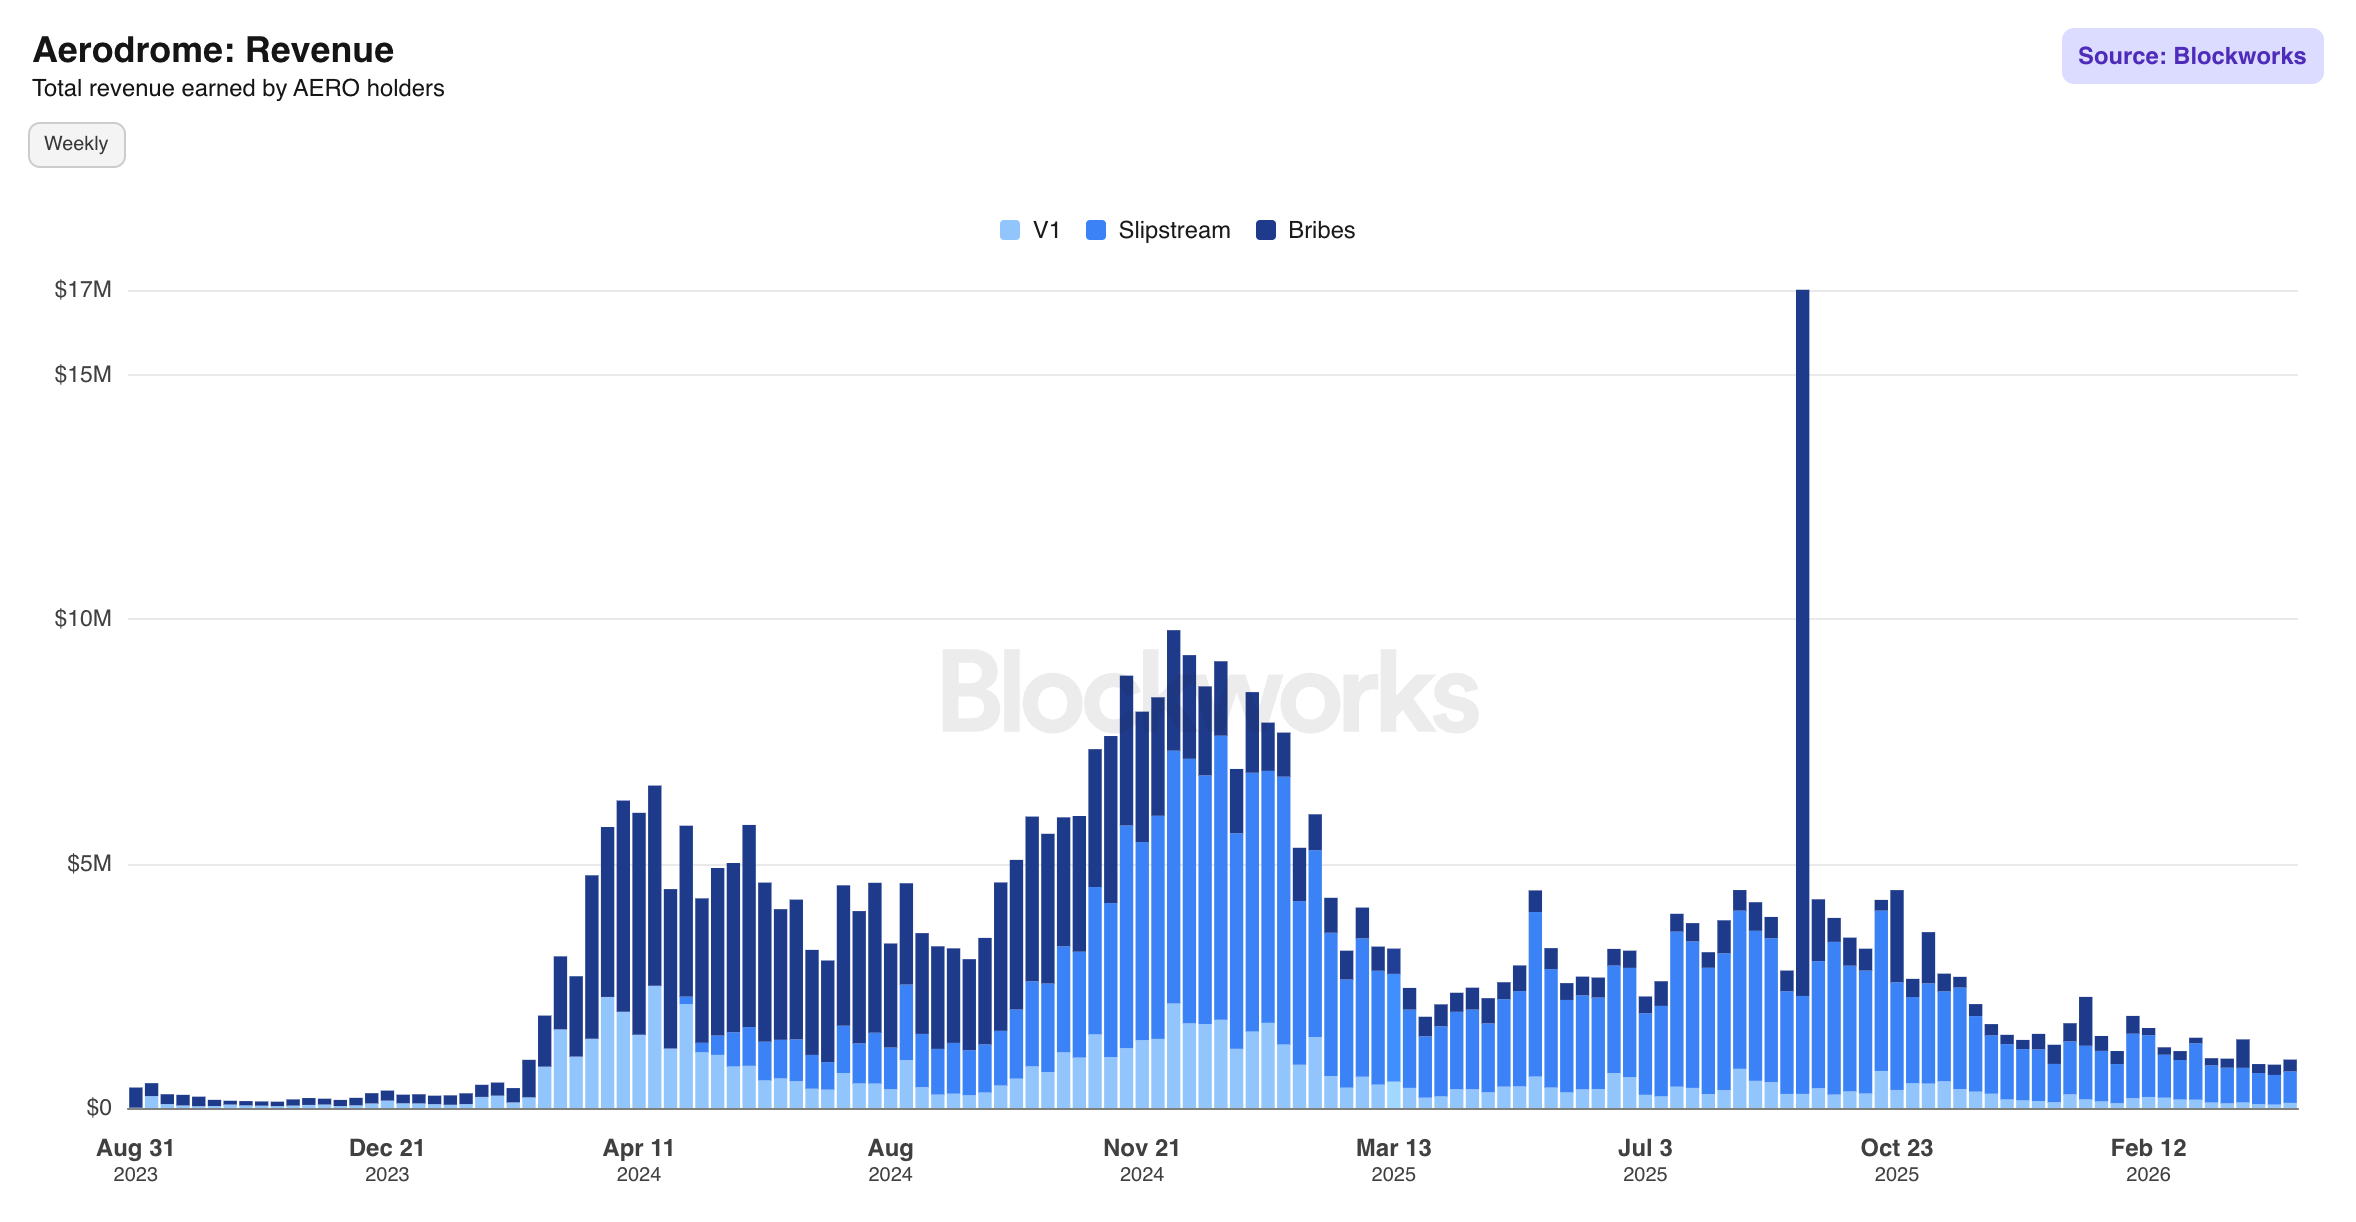
Revenue: Tracks total revenue earned by veAERO holders across timeframes, decomposed into V1 voter fee rewards, Slipstream voter fee rewards, and bribes. The $2.96M figure for the last four epochs is the most relevant summary stat.
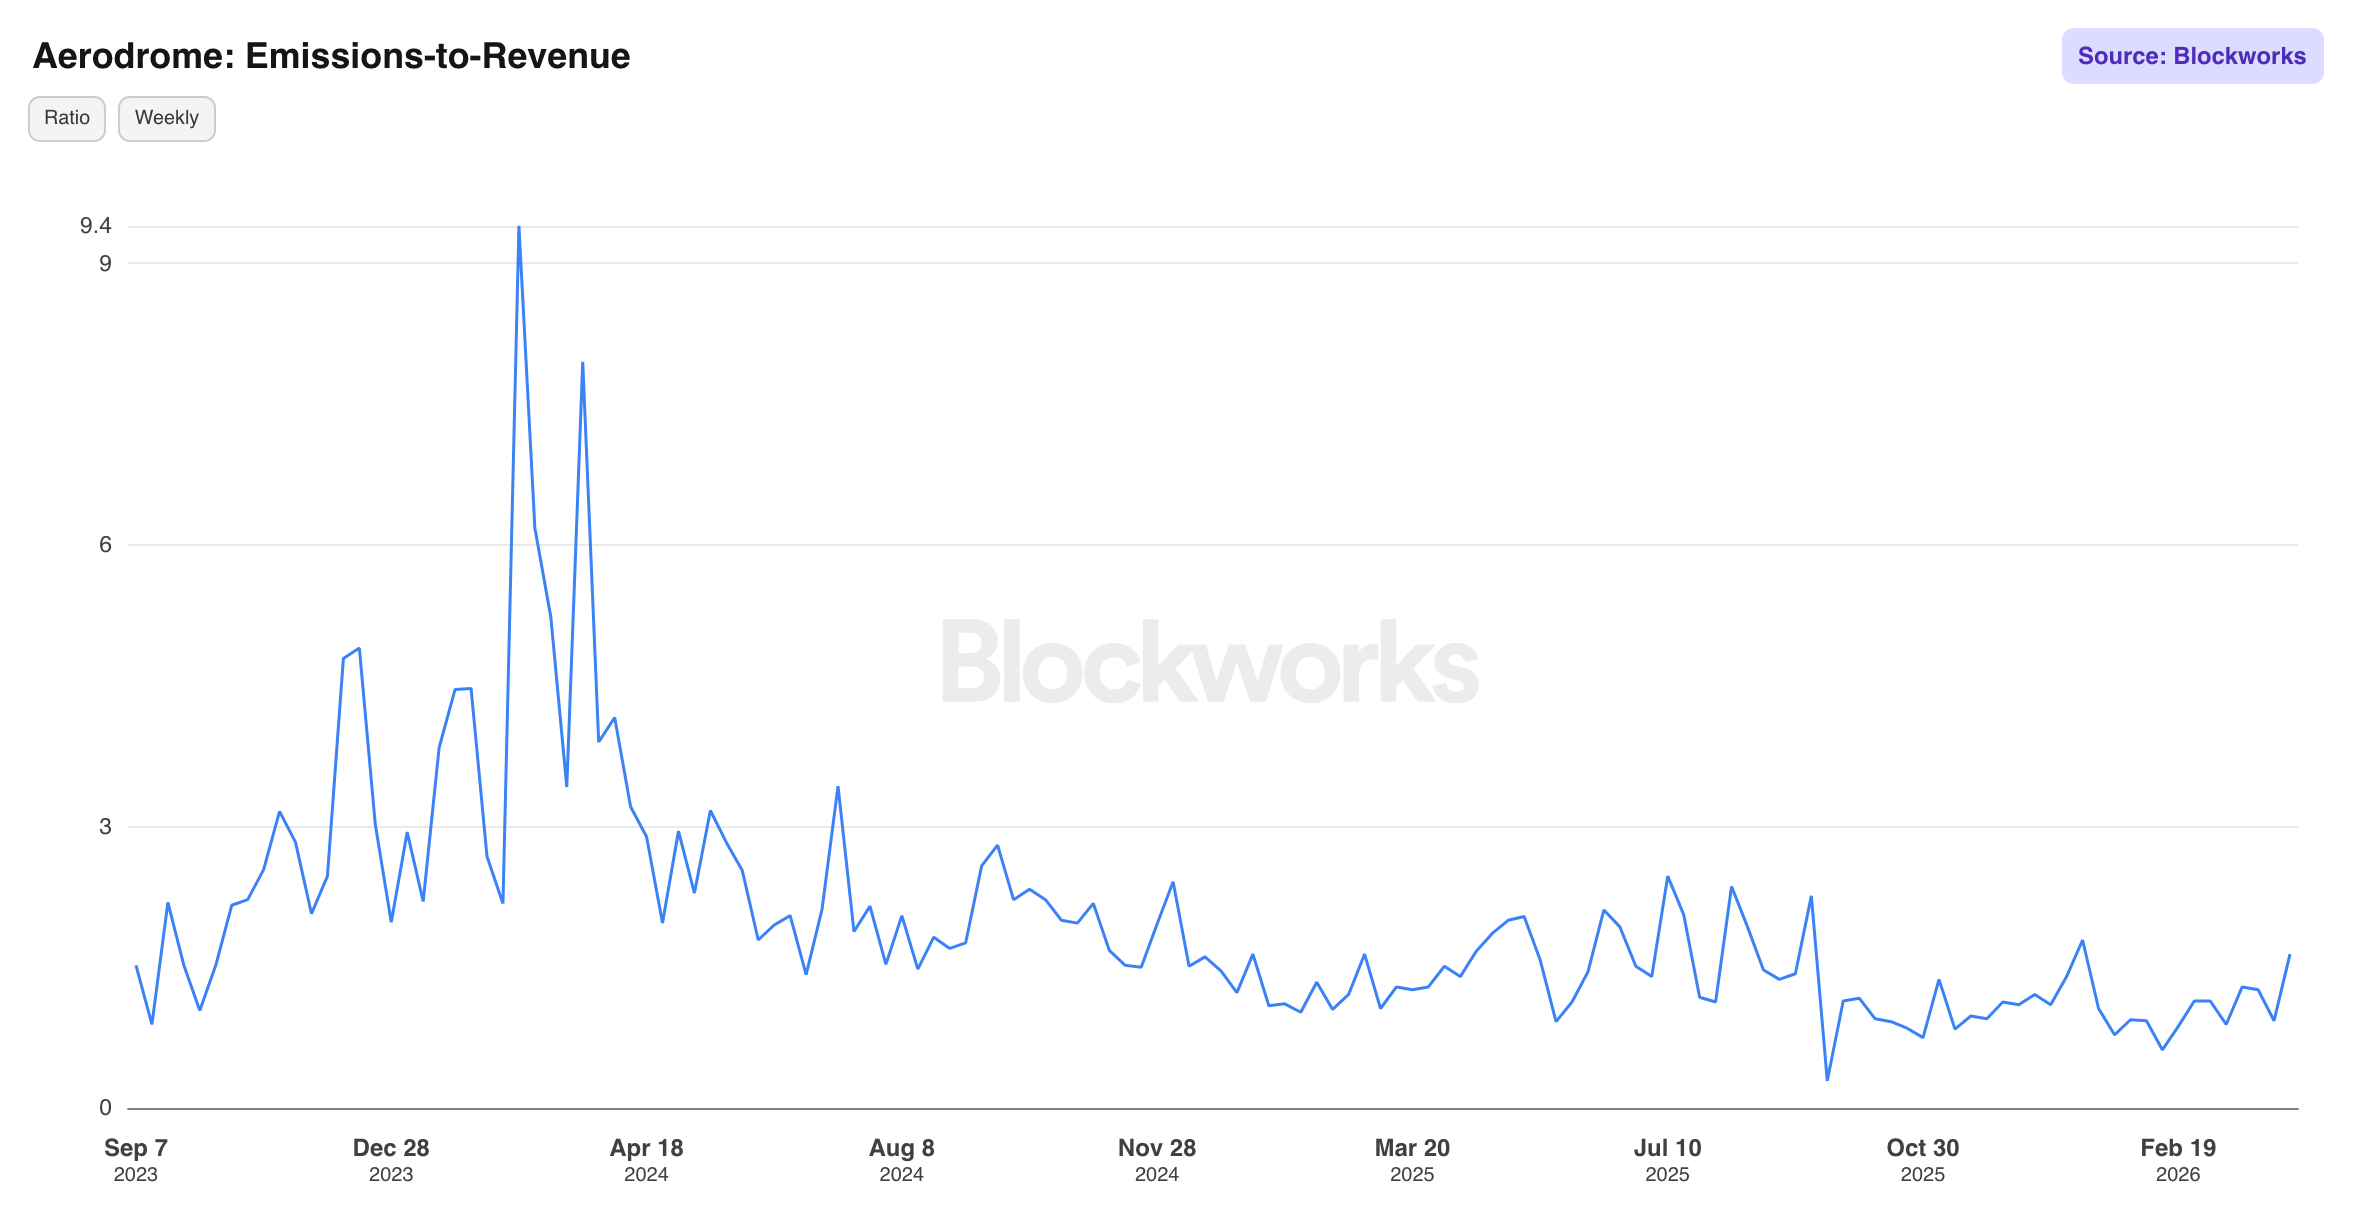
Emissions-to-Revenue: The E/R ratio is the protocol's most important fundamental metric. A ratio < 1.0 means the protocol earns more in fees than it pays out in emissions, while at a value > 1.0, it runs a net deficit. The current reading of 1.64 places Aerodrome back in deficit territory after briefly crossing below 1.0 in Q3 2025.
It's worth noting that this metric does not yet account for two offsets that meaningfully reduce the effective emissions burden: AERO buybacks and the share of newly emitted AERO that is immediately re-locked into veAERO positions rather than entering circulating supply. A net emissions figure, adjusted for buybacks and re-locks, would present a more complete picture of the protocol's true economic position. We're currently building that metric and will be adding it to the dashboard in the near future.
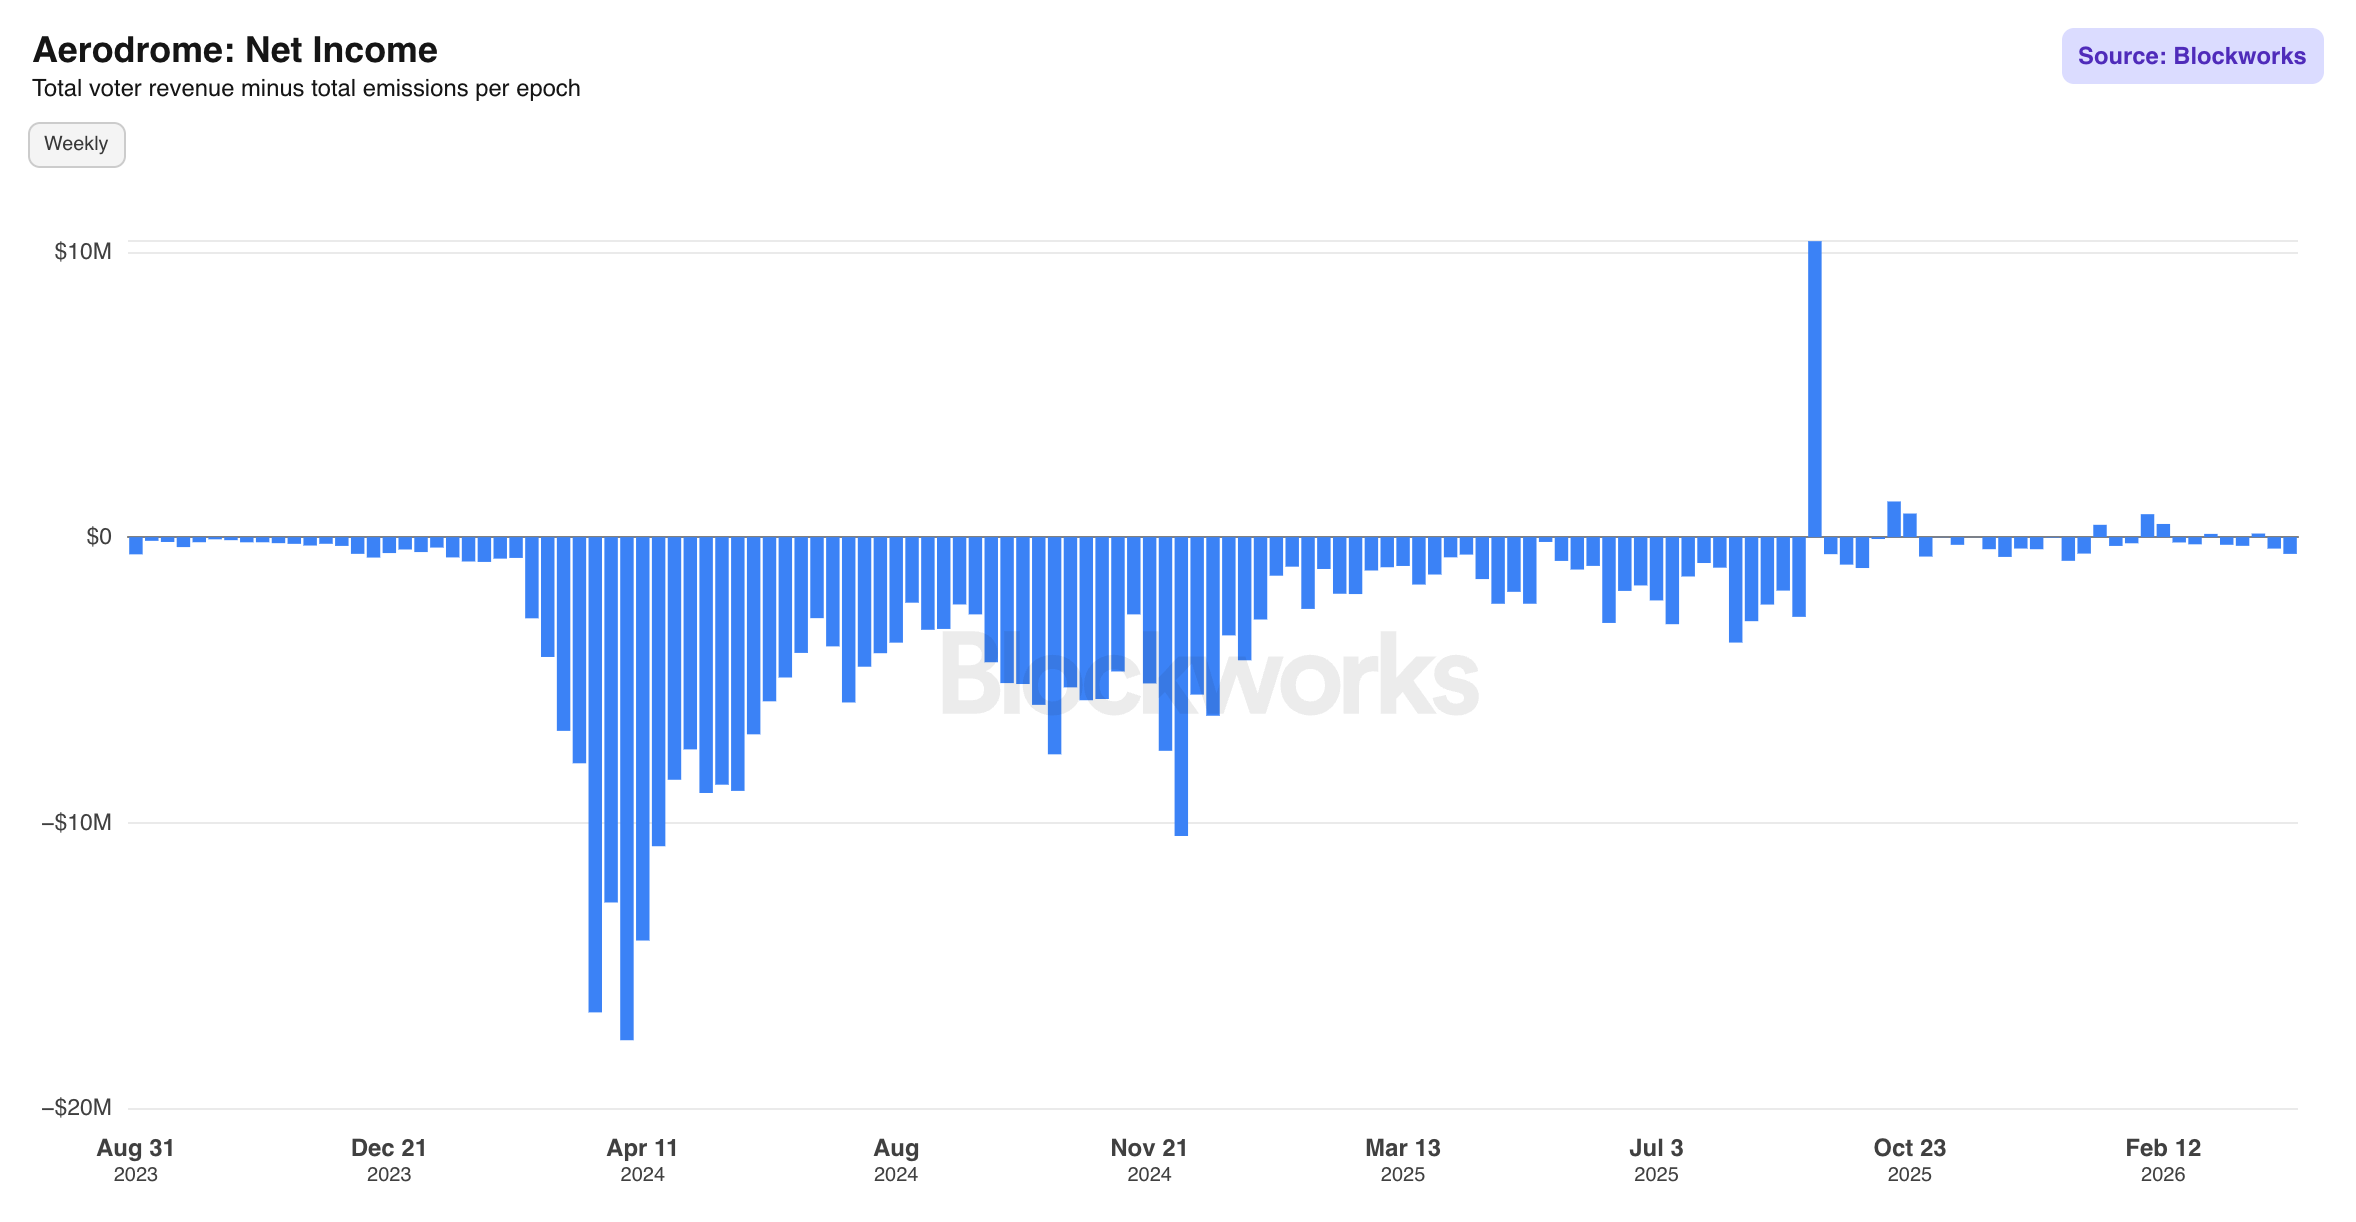
Net Income: Defined as prior-epoch voter revenue minus current-epoch emissions, this chart converts the forward-shifted E/R ratio into dollar terms. Epoch 135 produced $126.9K in positive net income. Epochs 136 and 137 have since turned negative at -$400K and -$586K respectively.
AERO Token
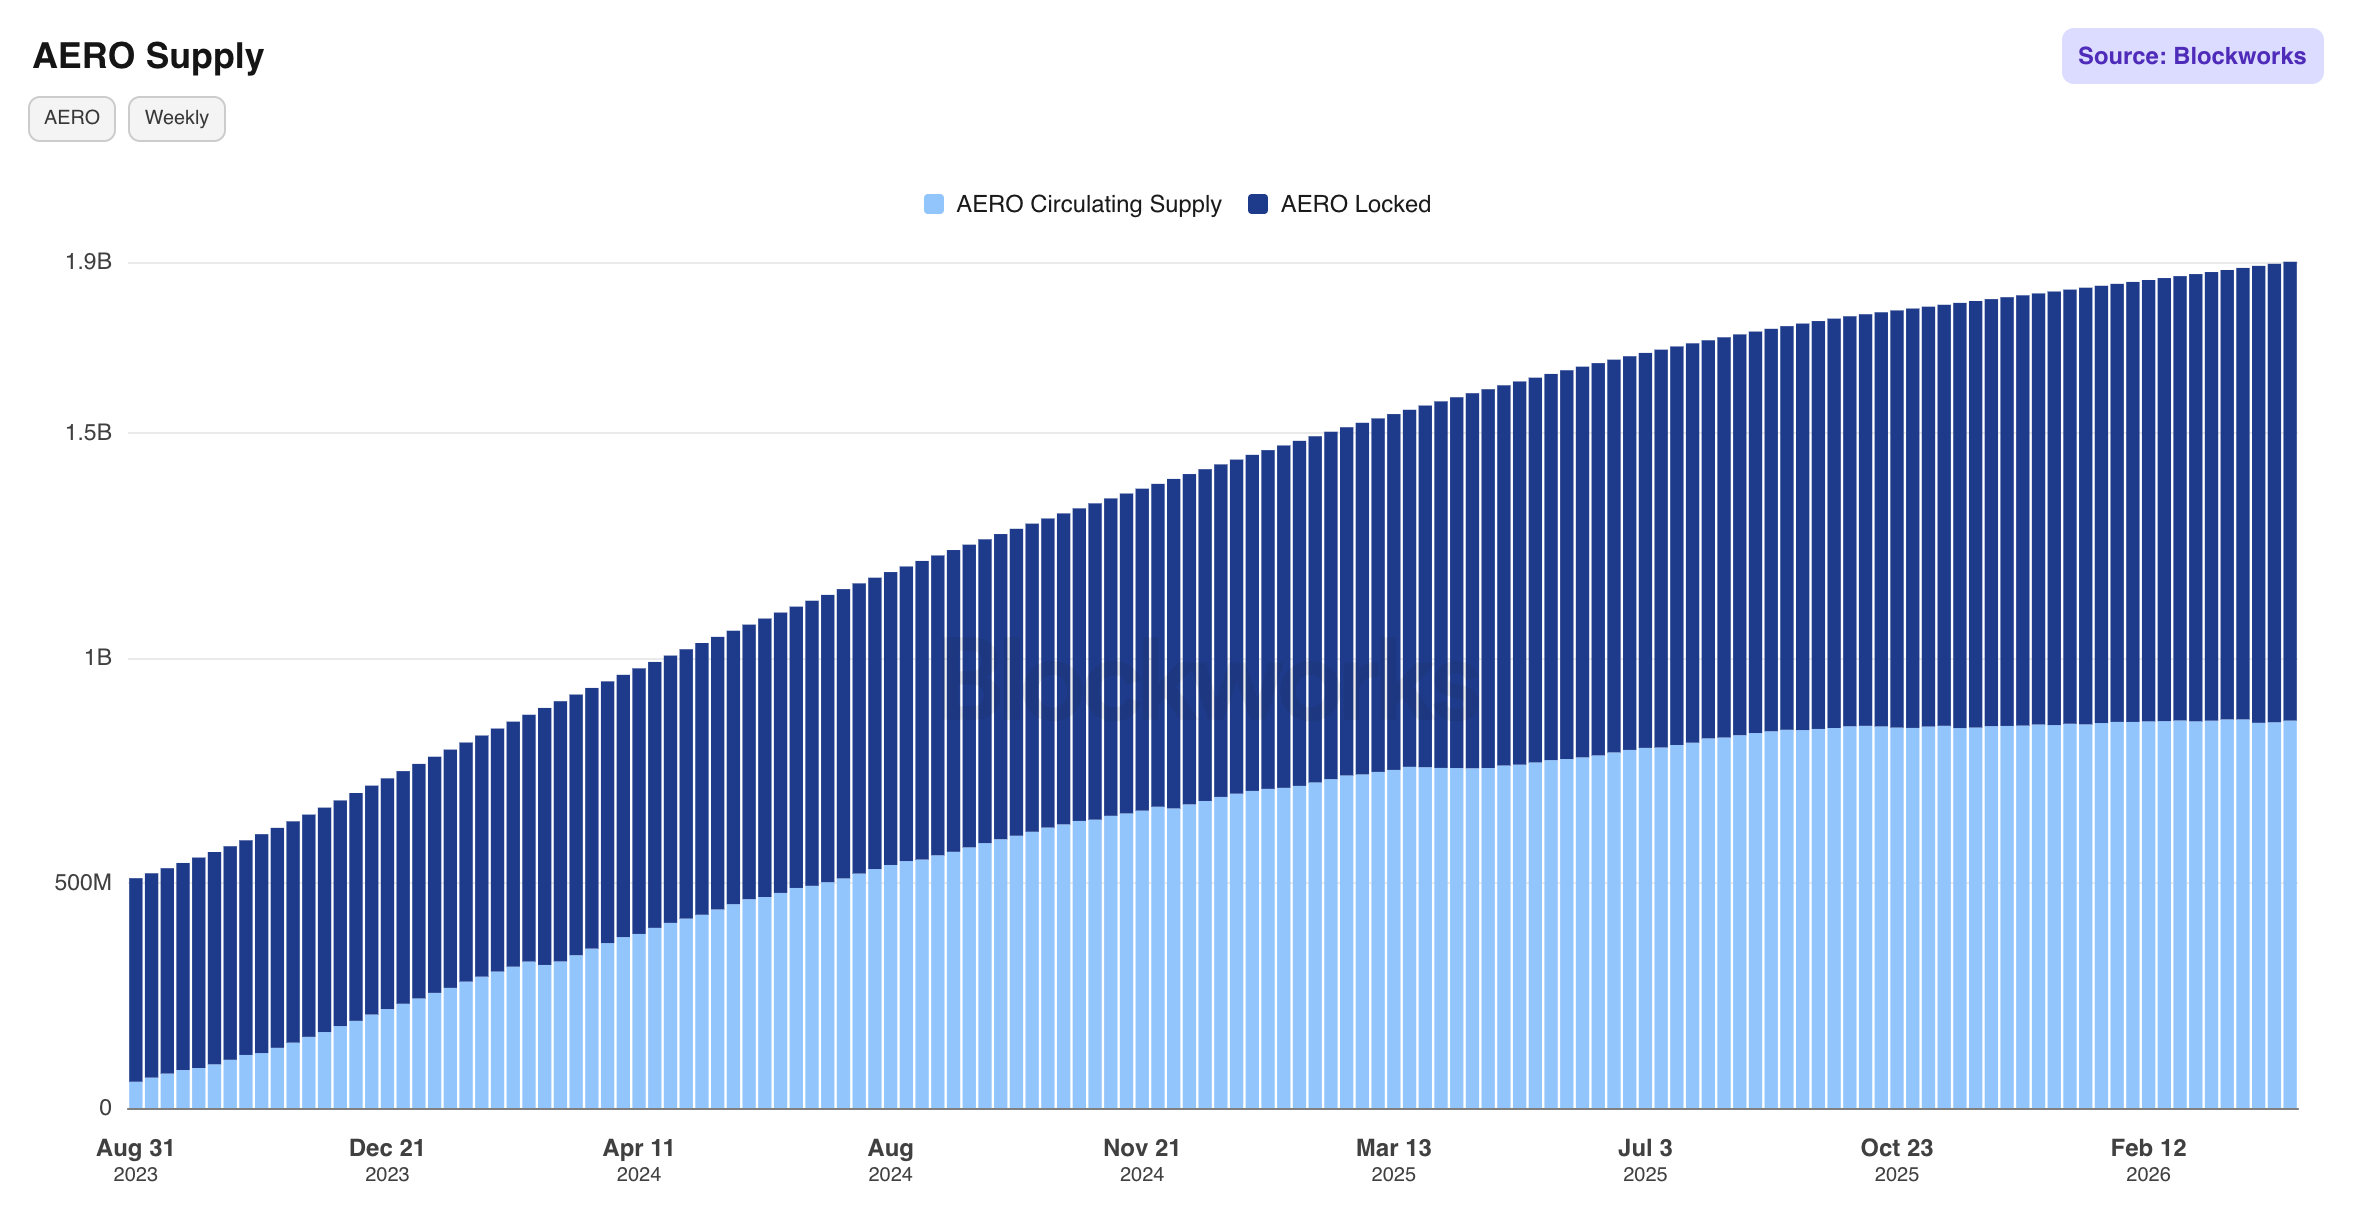
Supply: Tracks total minted AERO split between circulating supply and tokens locked in veAERO positions. Total supply has grown to ~1.9B tokens through cumulative emissions, with a substantial portion held in veAERO locks.
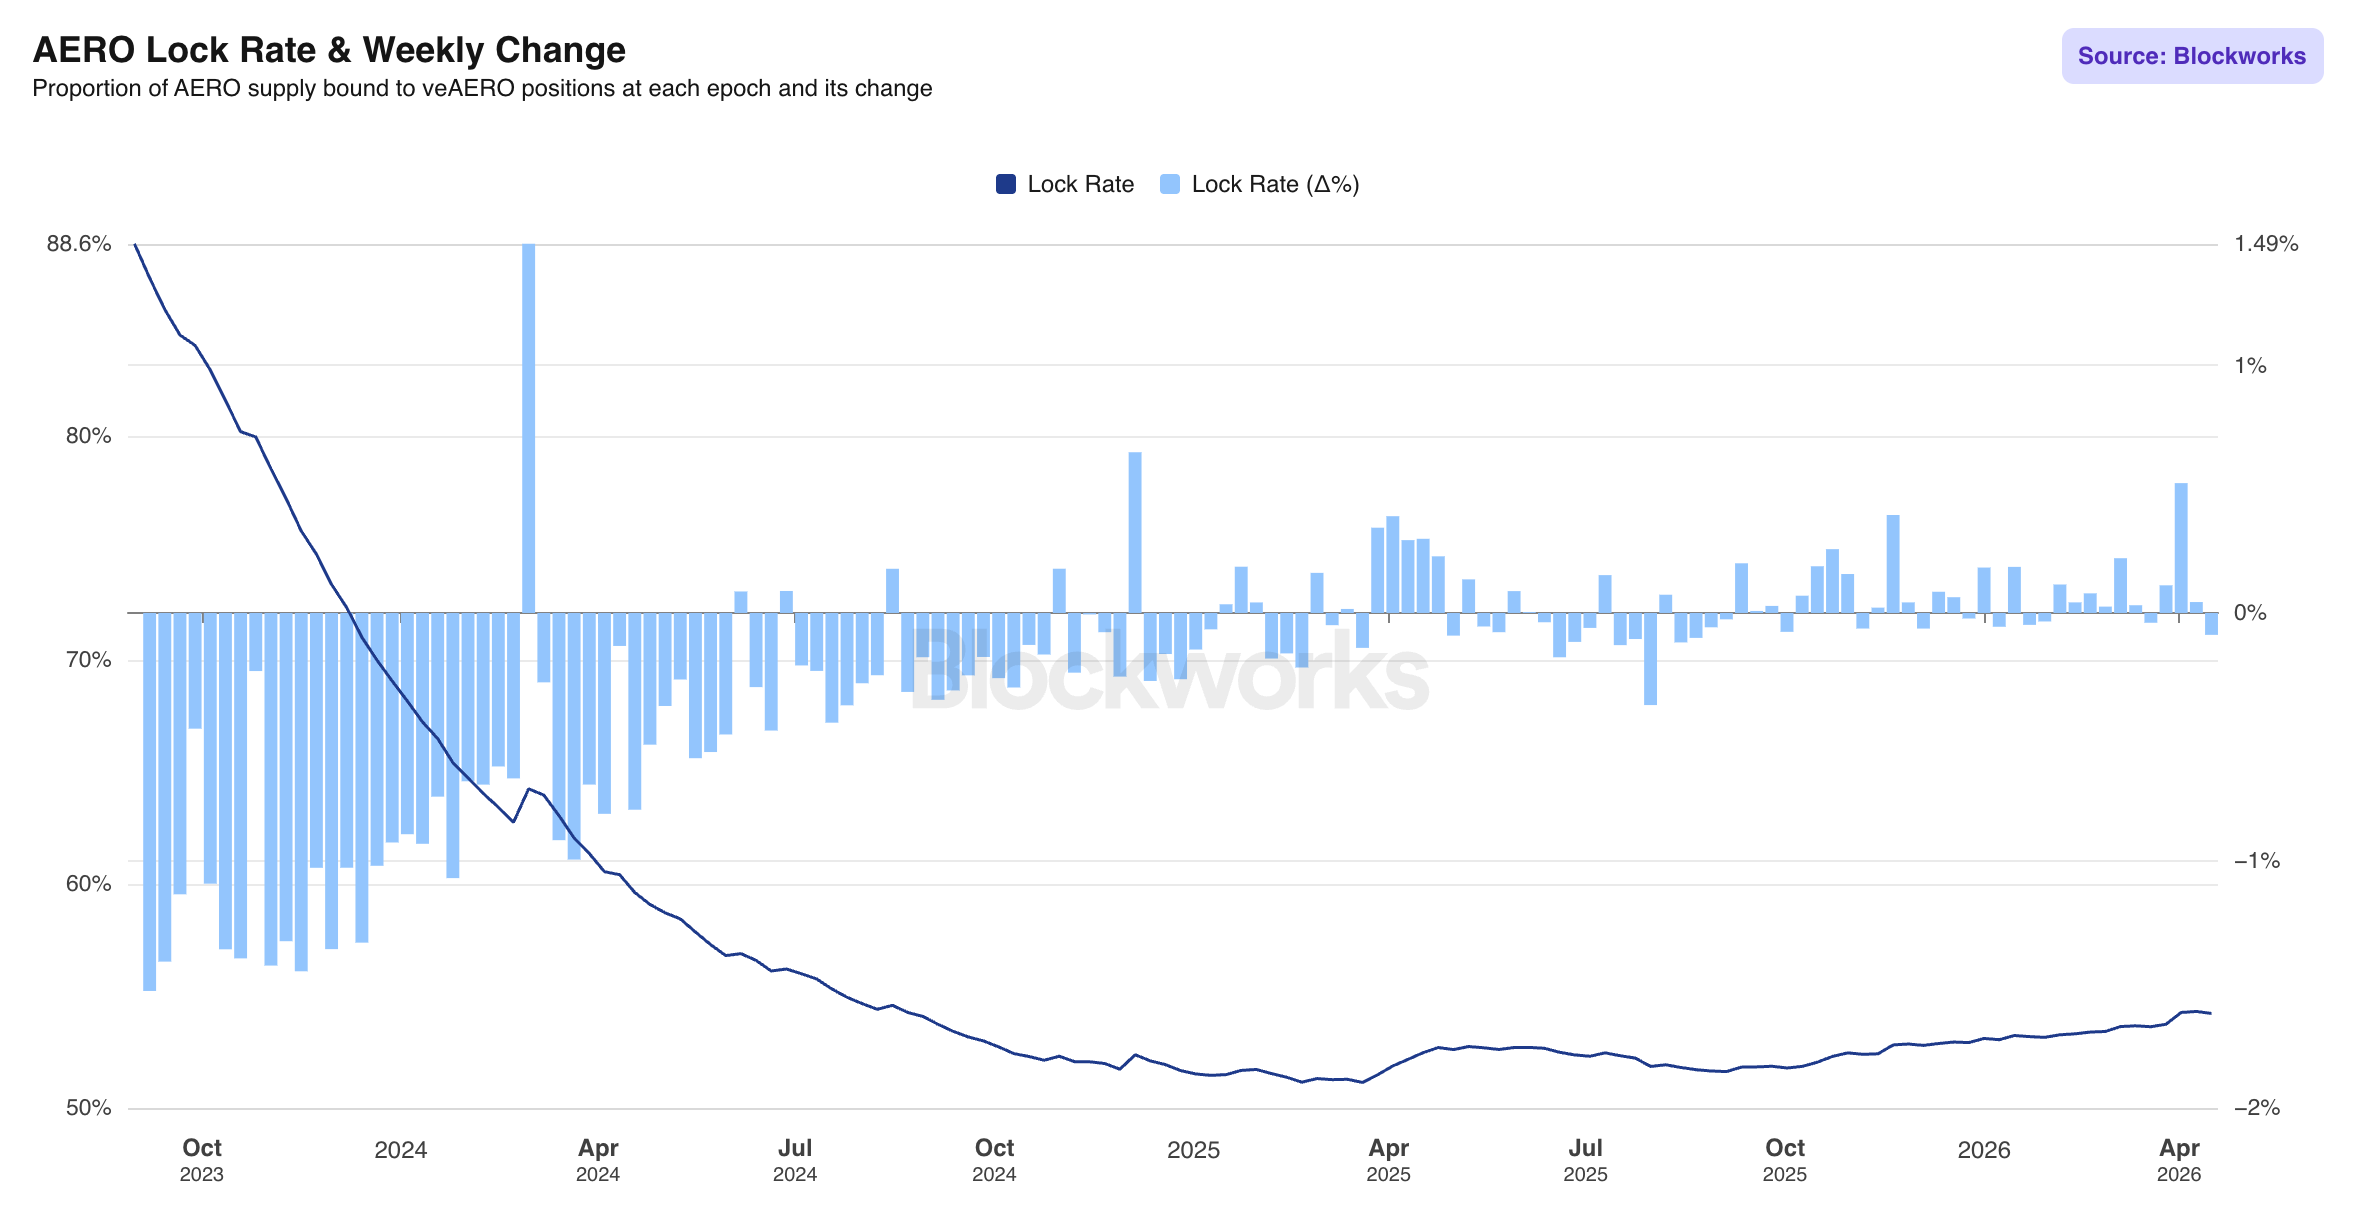
Lock Rate and Weekly Change: Plots the proportion of total AERO supply bound to veAERO positions alongside its weekly delta. The lock rate has declined from a launch-era peak of ~88.6% and has stabilized in the 50-55% range. Sustained positive deltas indicate net new locking exceeding unlocks and new emissions, mechanically reducing sell pressure, while negative deltas in recent epochs warrant monitoring.
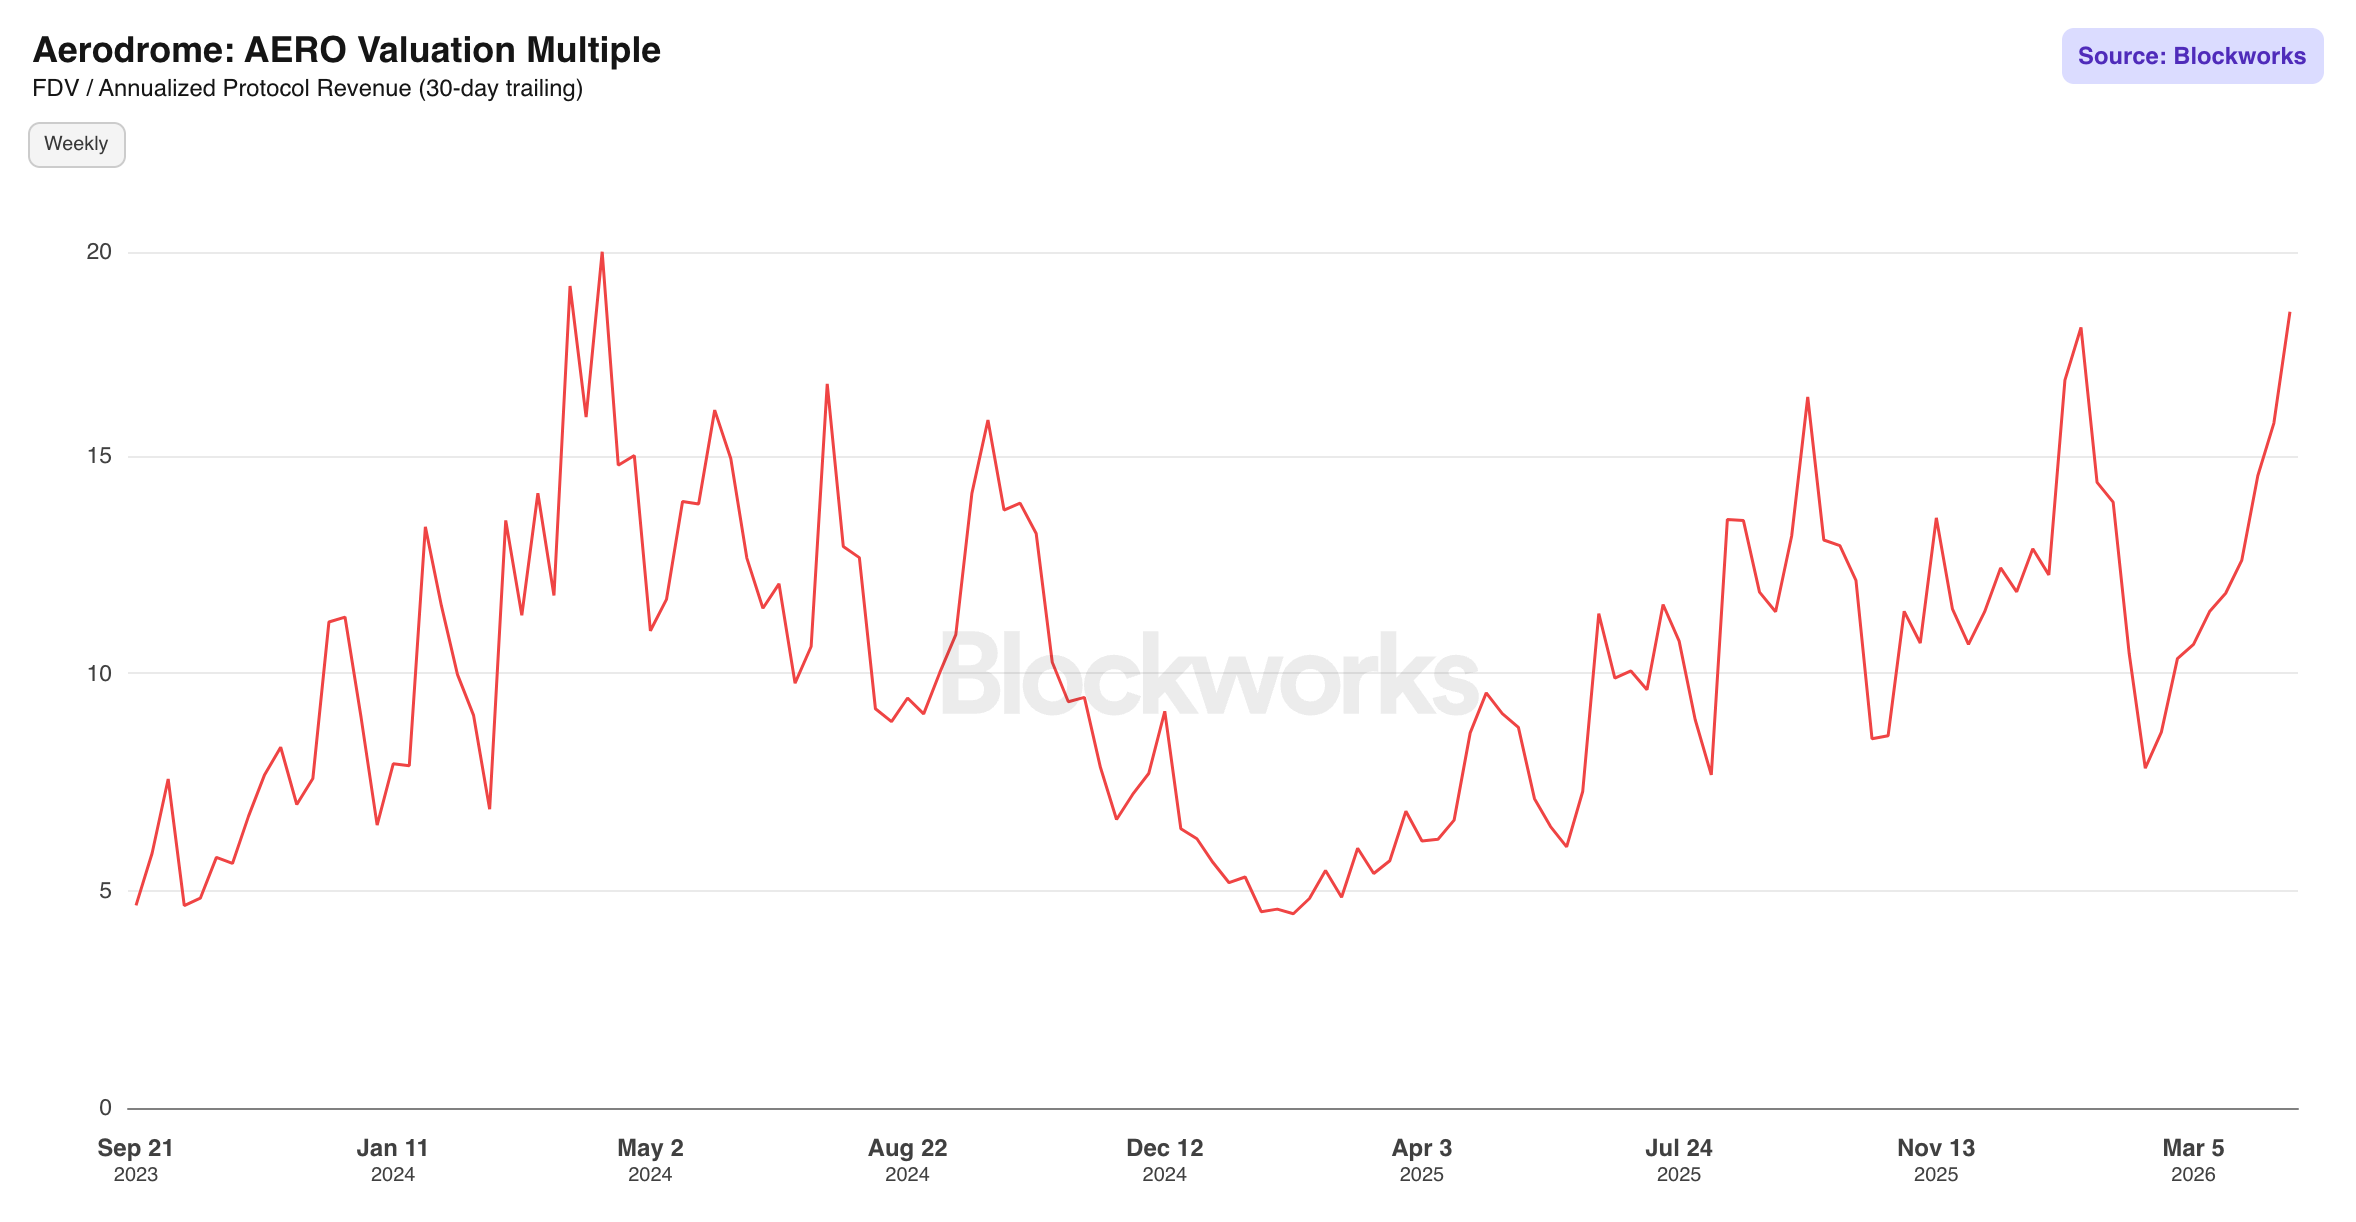
Valuation Multiple: Defined as FDV divided by annualized protocol revenue on a 30-day trailing basis. The multiple has ranged ~5-18x over the protocol's history, compressing toward the lower end during peak revenue periods in mid-2025 before re-expanding as revenue softened.
Governance
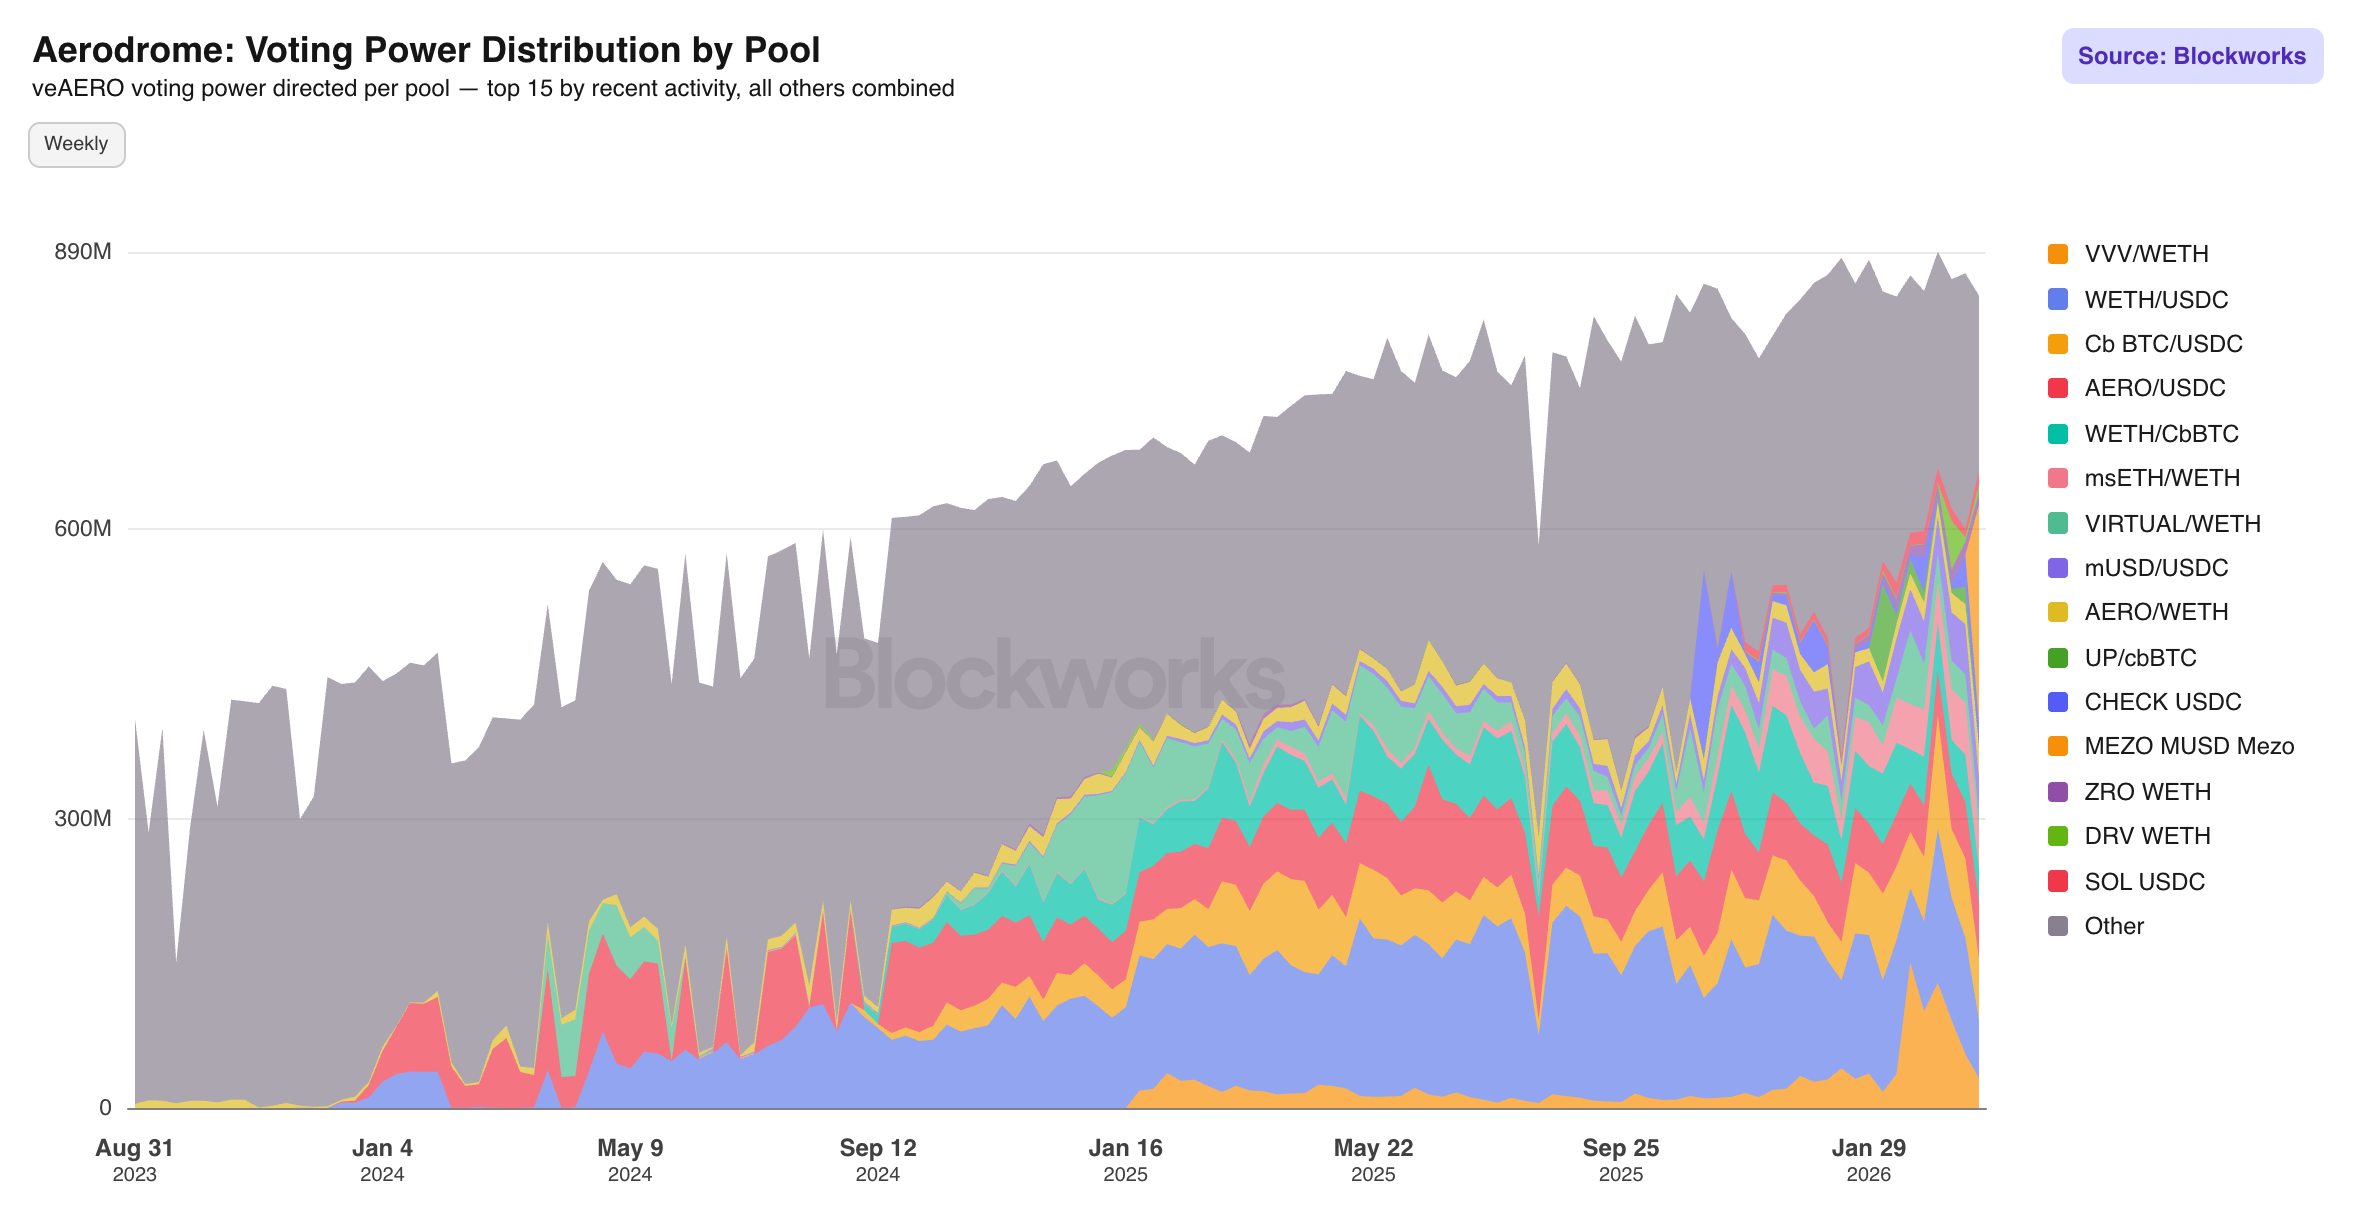
Voting Power Distribution by Pool: This stacked area chart shows veAERO voting power directed to the top 15 pools each epoch, with all others combined. The distribution across 501 active pools indicates a healthy competitive dynamic rather than governance capture by a small number of whales, though the top five pools still command a disproportionate share of total vote weight.
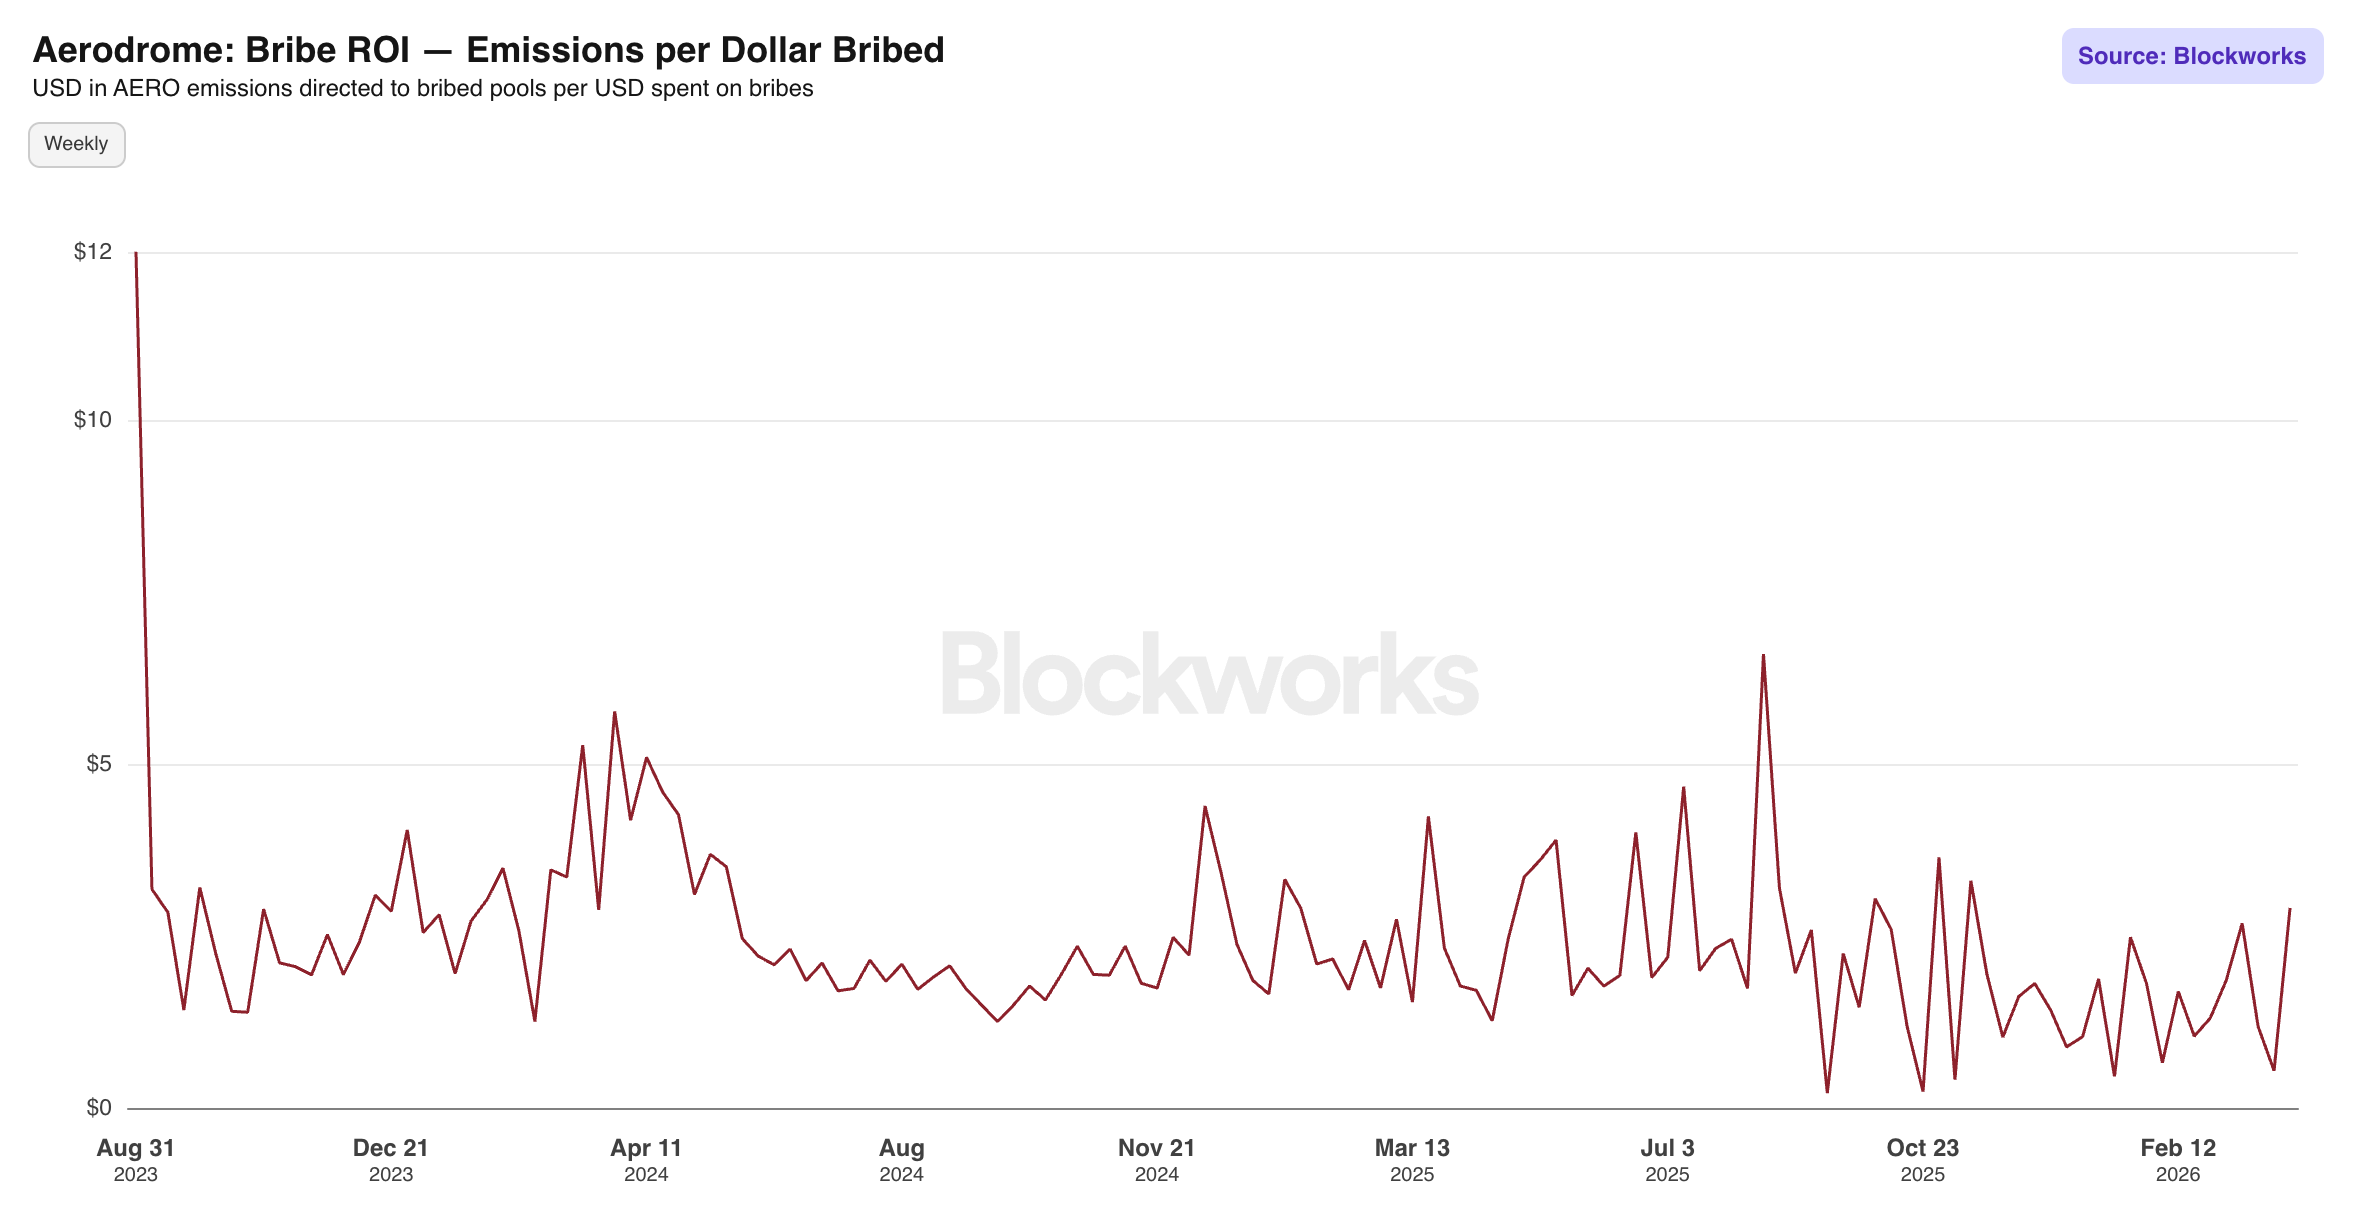
Bribe ROI — Emissions per Dollar Bribed: Measures how many dollars of AERO emissions flow to a pool per dollar deposited as a bribe. A high ROI means external protocols are getting significant leverage on their bribe spend, making Aerodrome's liquidity marketplace attractive for bootstrapping.
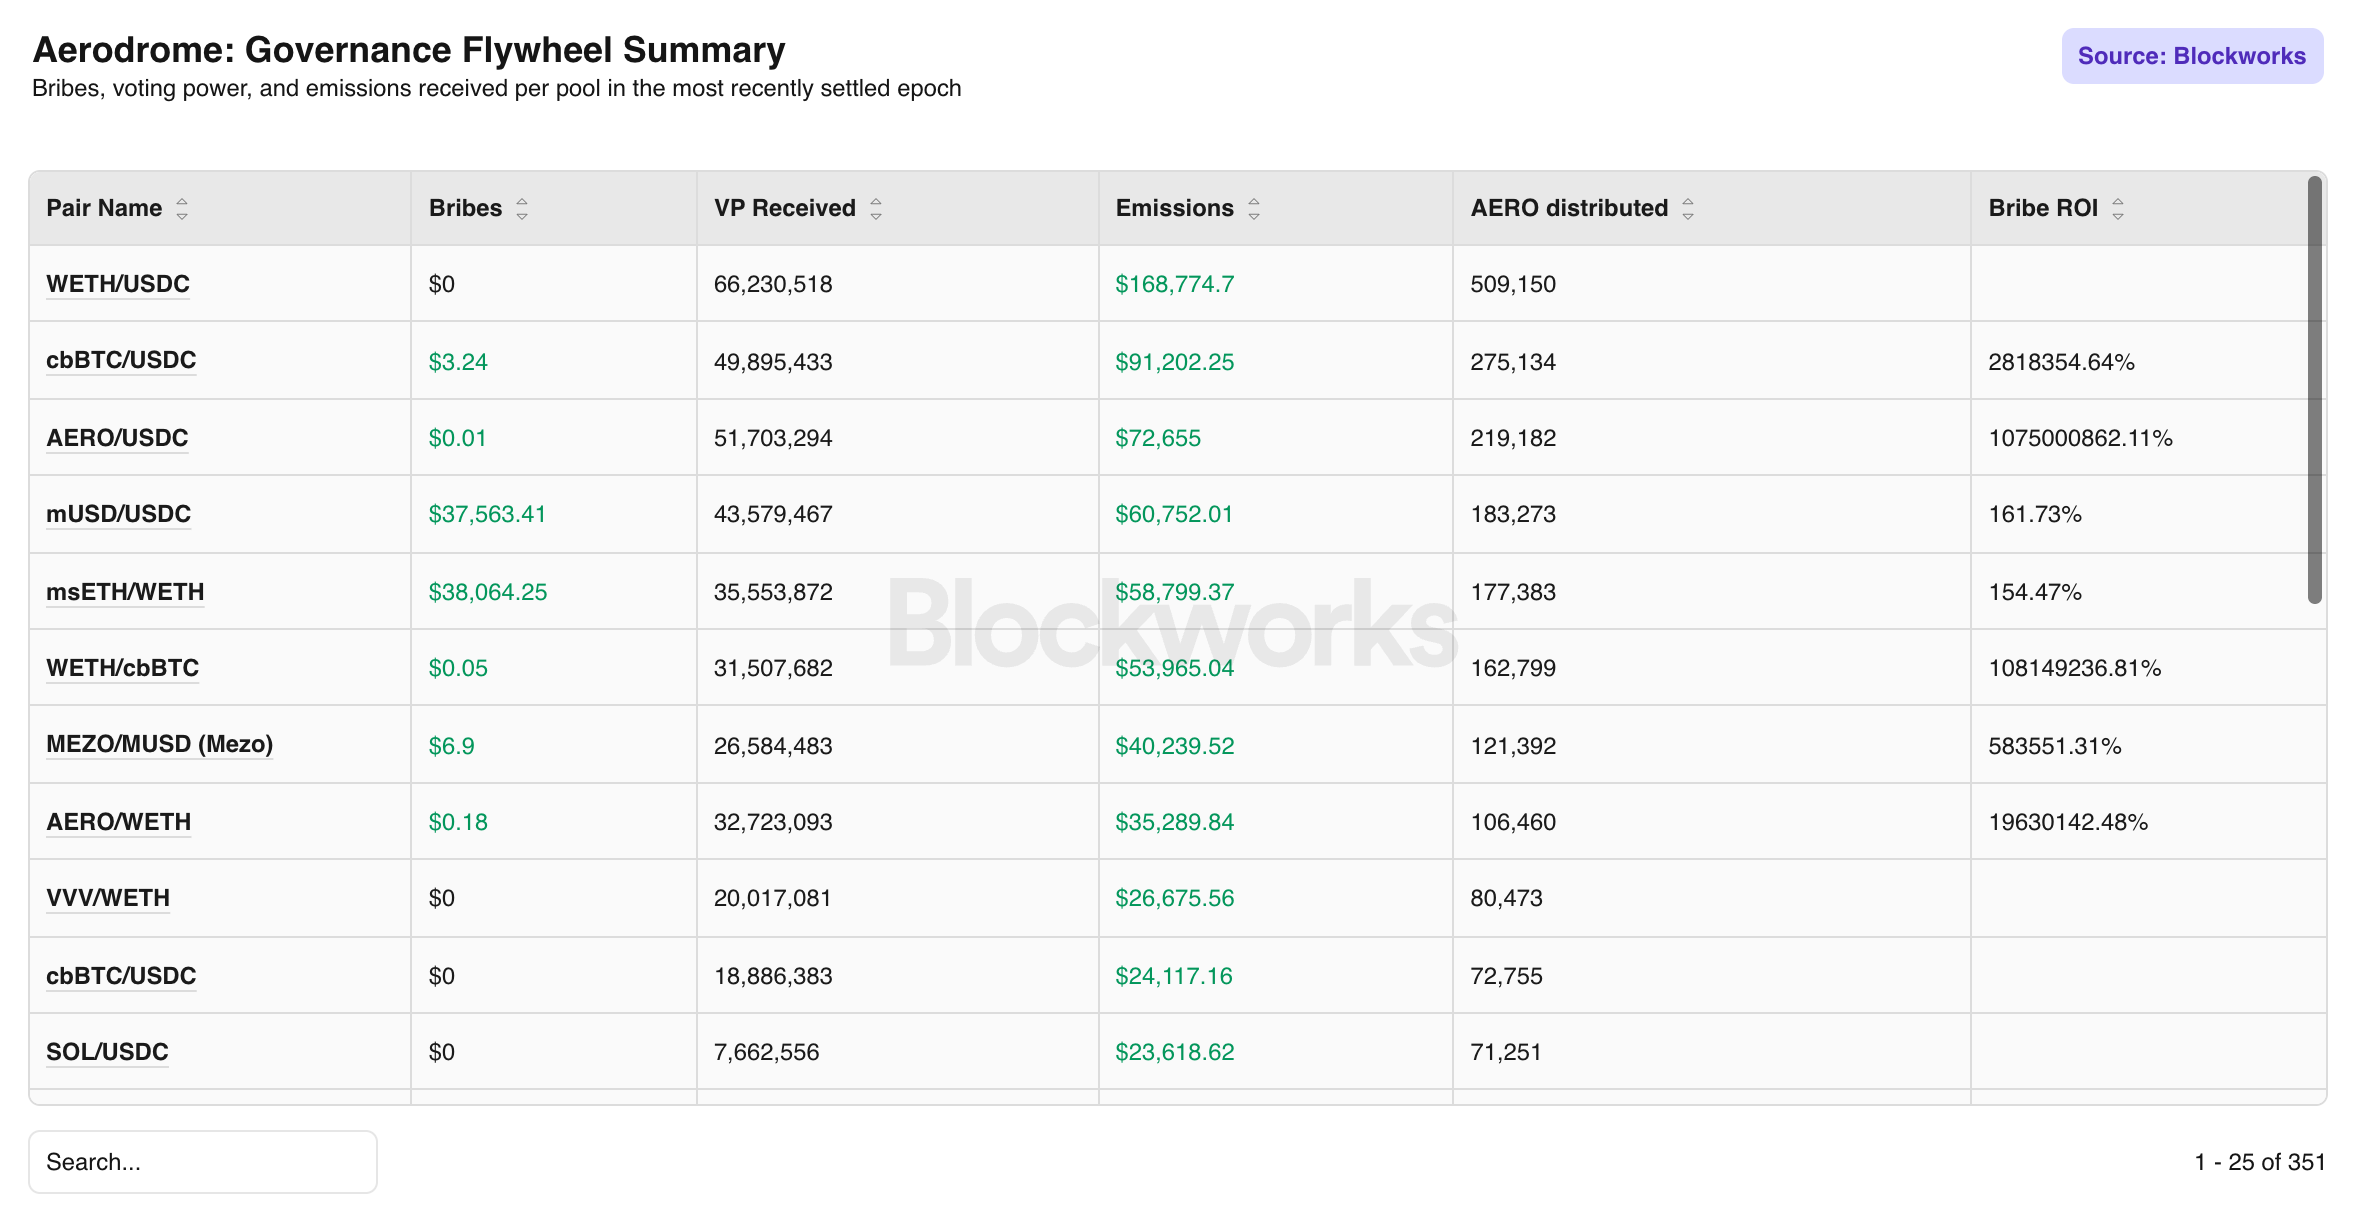
Governance Flywheel Summary: Consolidates bribes, voting power received, emissions, and AERO distributed per pool in the most recently settled epoch into a single view. The extreme Bribe ROI figures visible for low-bribe, high-vote pools like cbBTC/USDC (2,818,354%) reflect organic voter interest rather than meaningful leverage from bribing, and should be read as confirmation of those pools' structural dominance.
veNFT
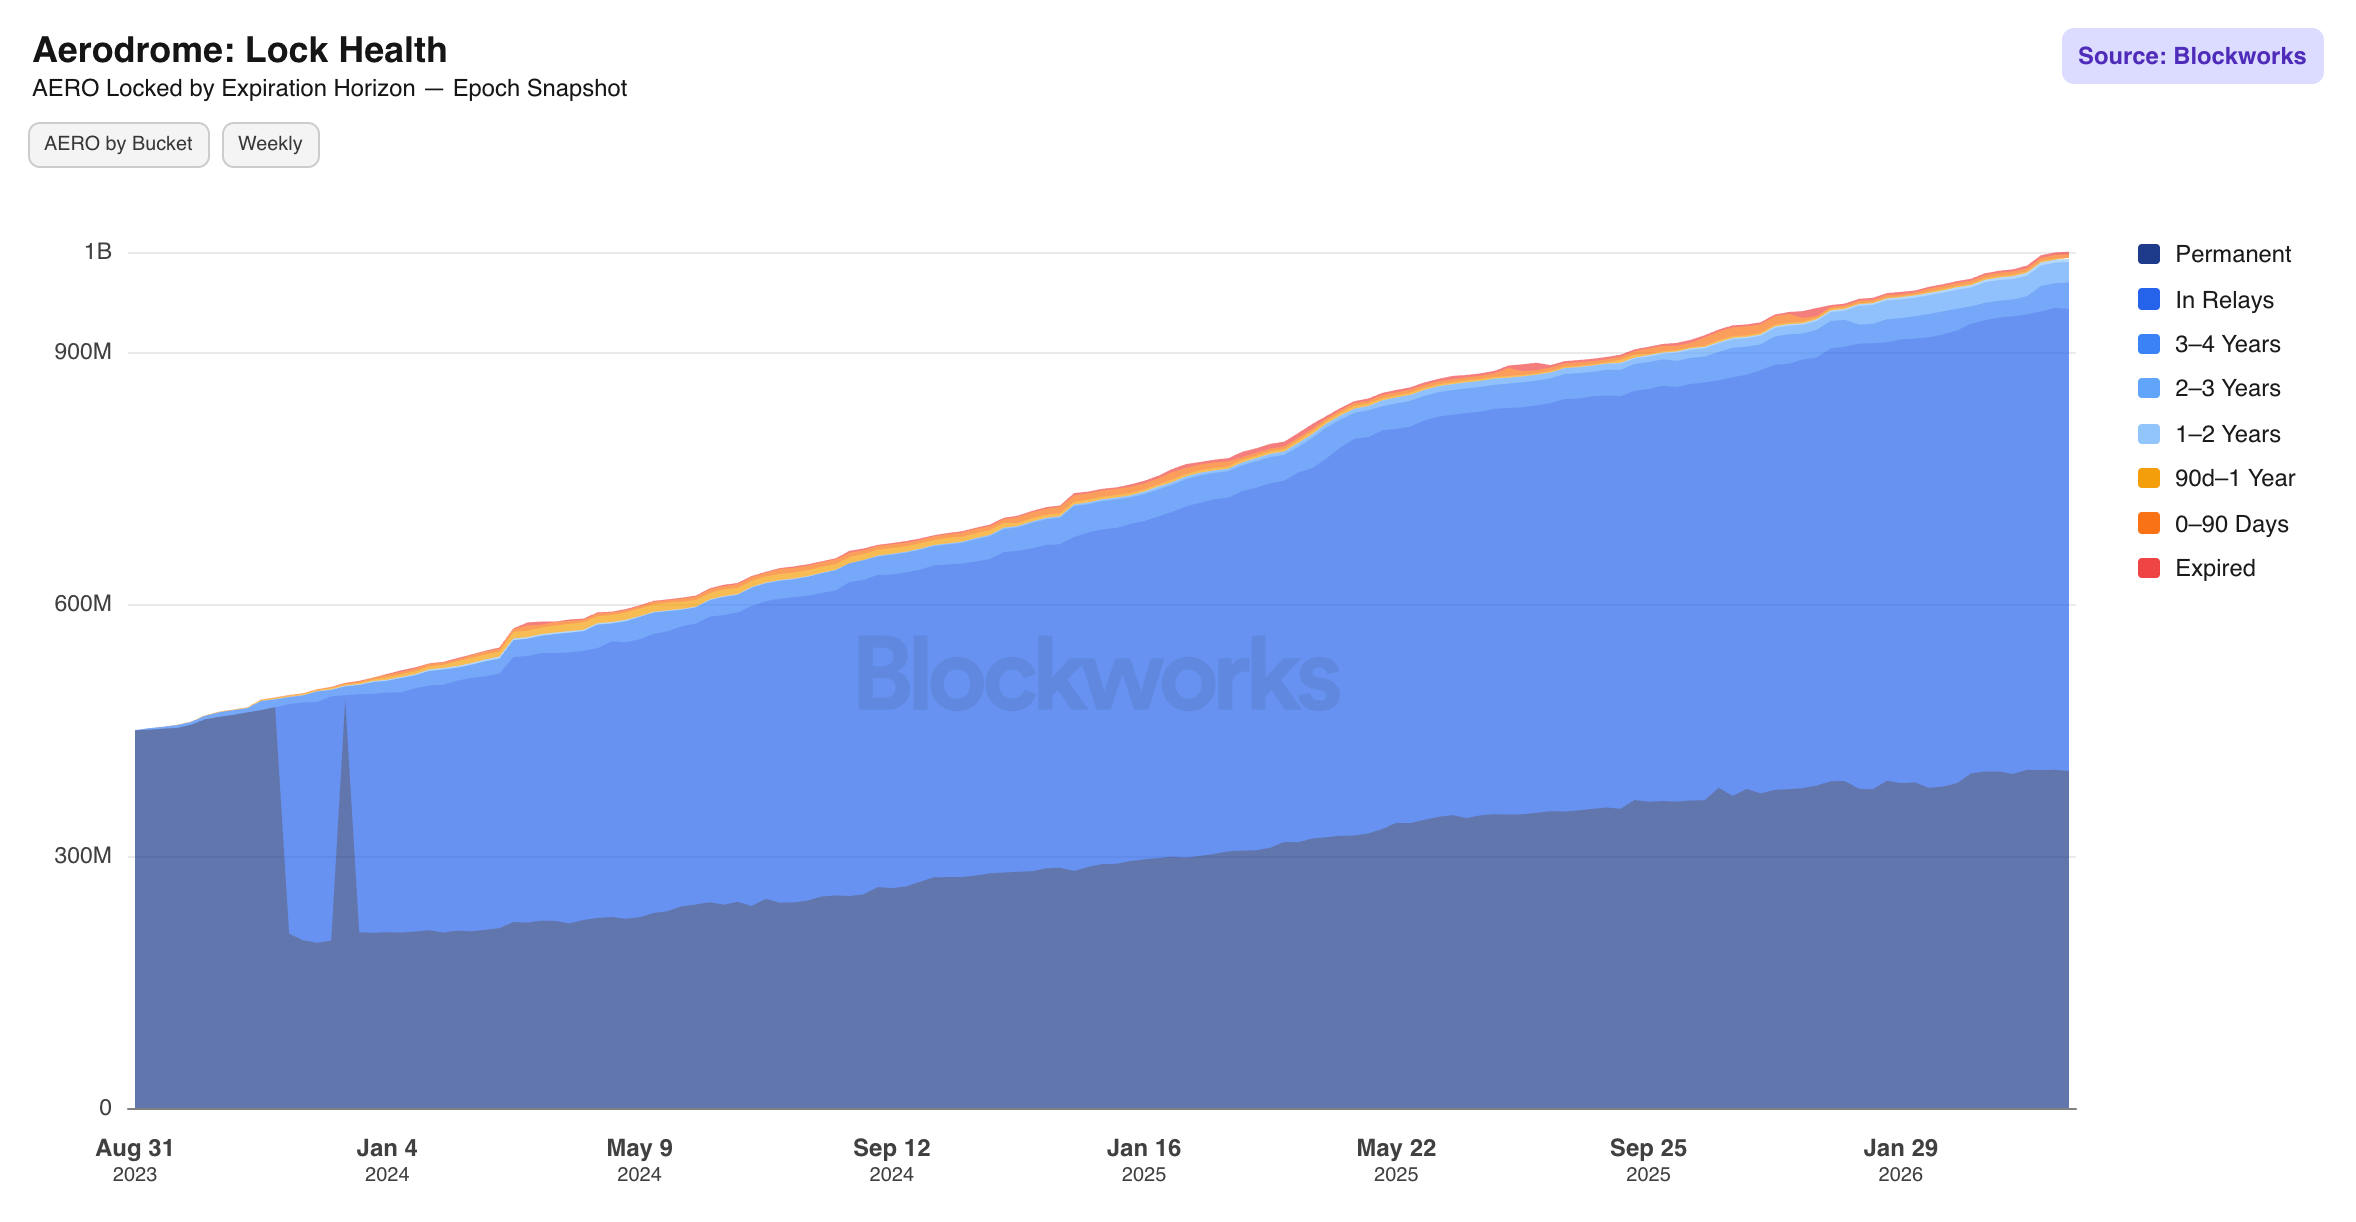
Lock Health: Total AERO locked segmented by expiration horizon. The dominant share sitting in the Permanent and In Relays buckets signals permanent locks continuously renewing at maximum voting power and representing structurally committed capital that cannot re-enter circulating supply without a deliberate governance action. A distribution skewed toward the longer-duration and permanent buckets indicates strong conviction among governance participants.
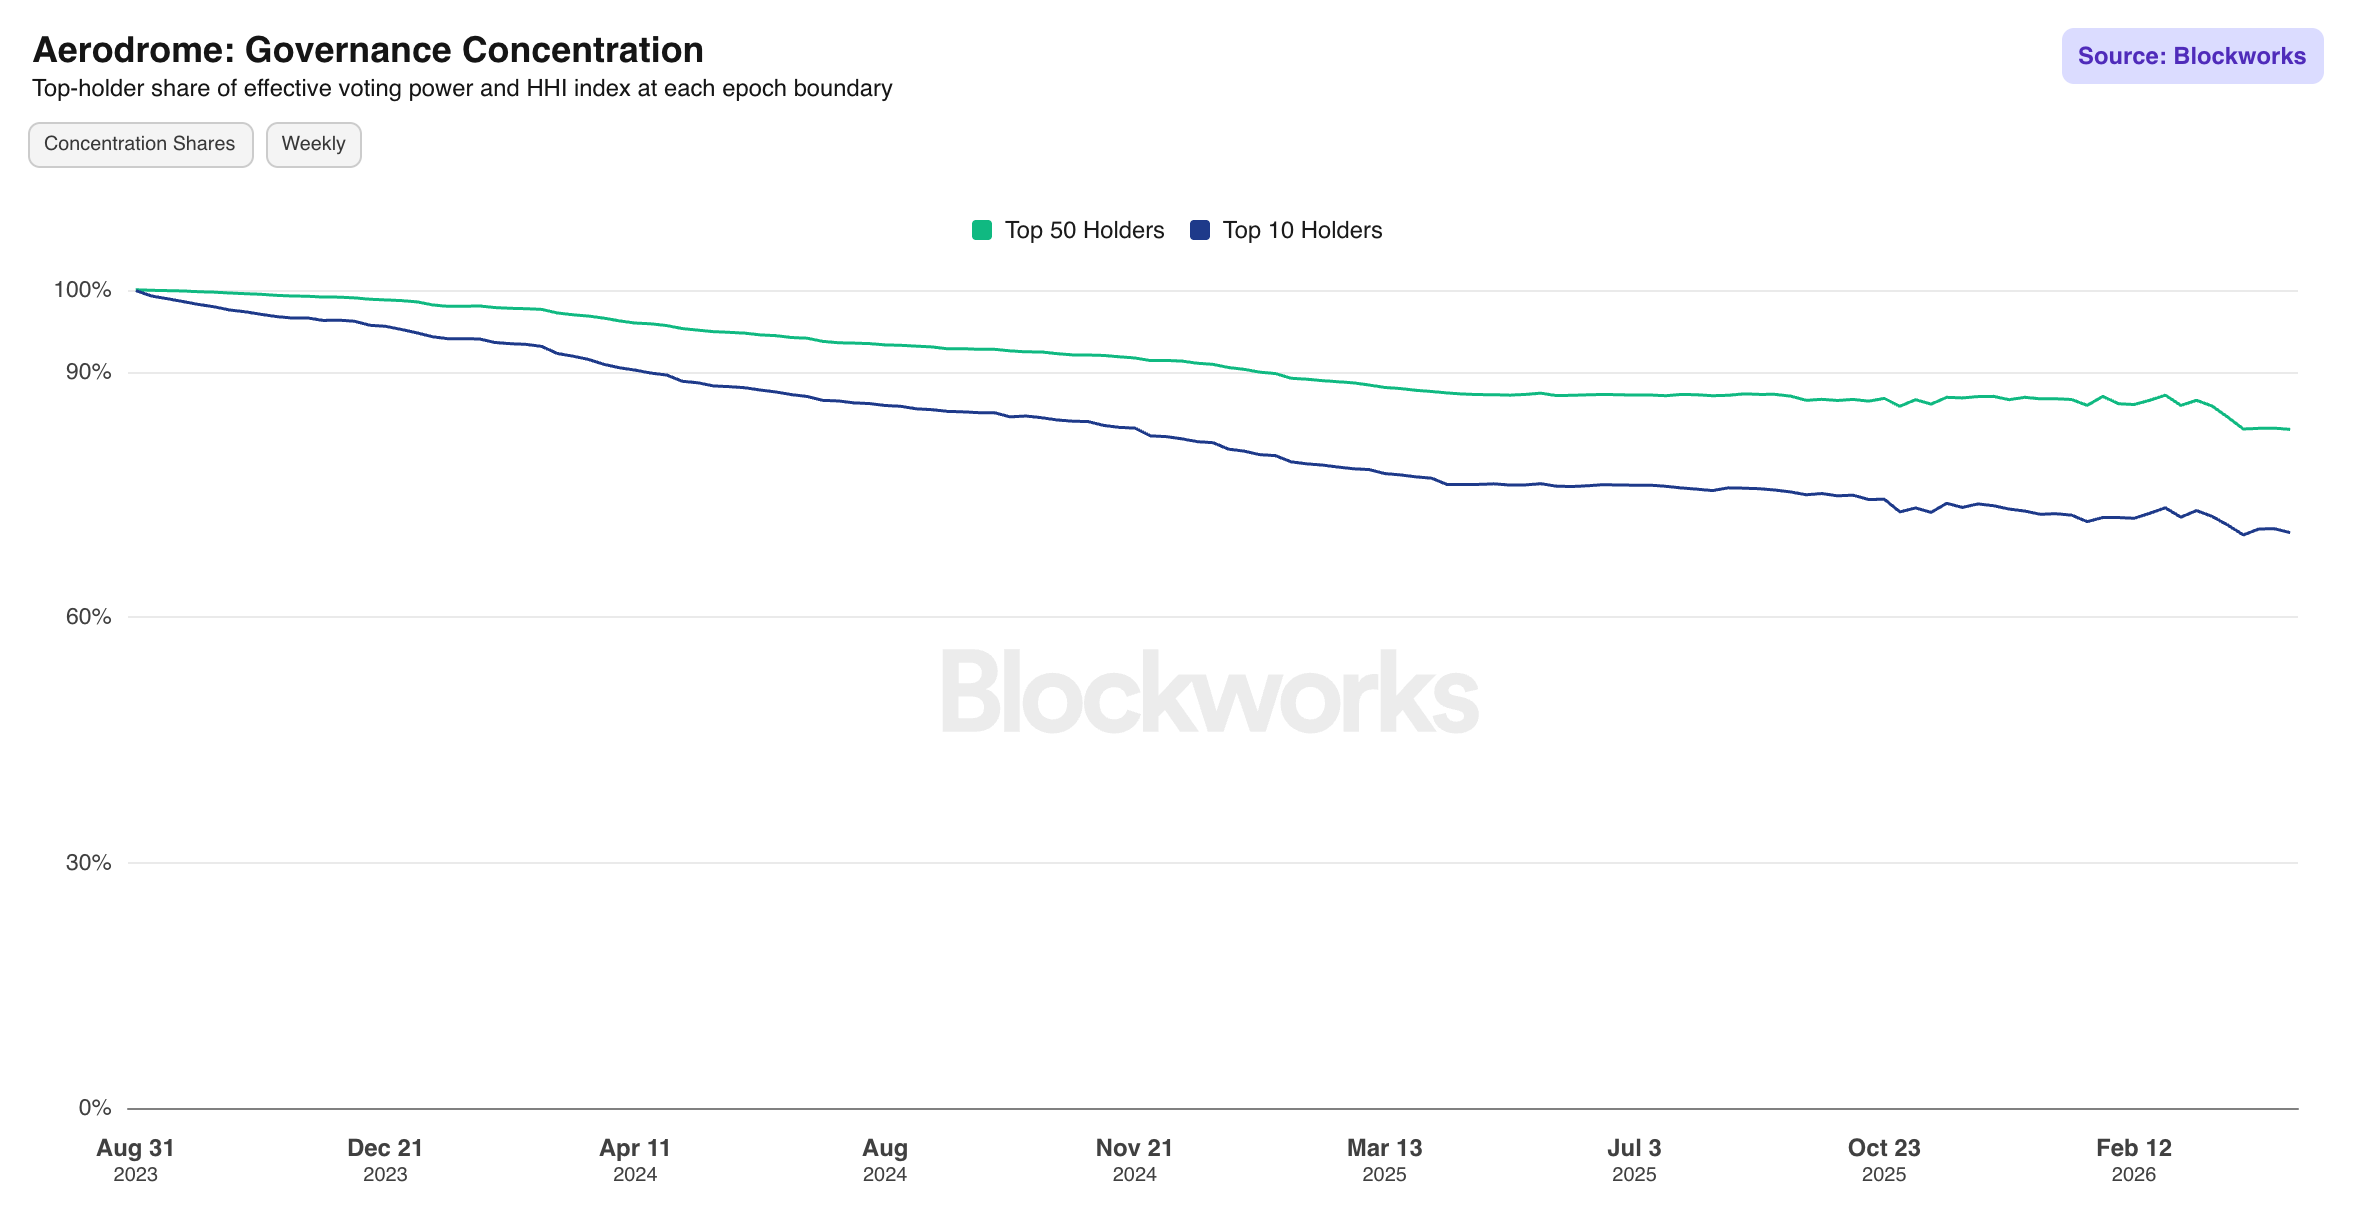
Governance Concentration: Tracks the share of effective voting power held by the top 10 and top 50 veAERO holders at each epoch boundary. The top 10 concentration has declined from ~95.3% in Dec. 2023 toward the 83% range, reflecting organic distribution as new participants lock AERO.
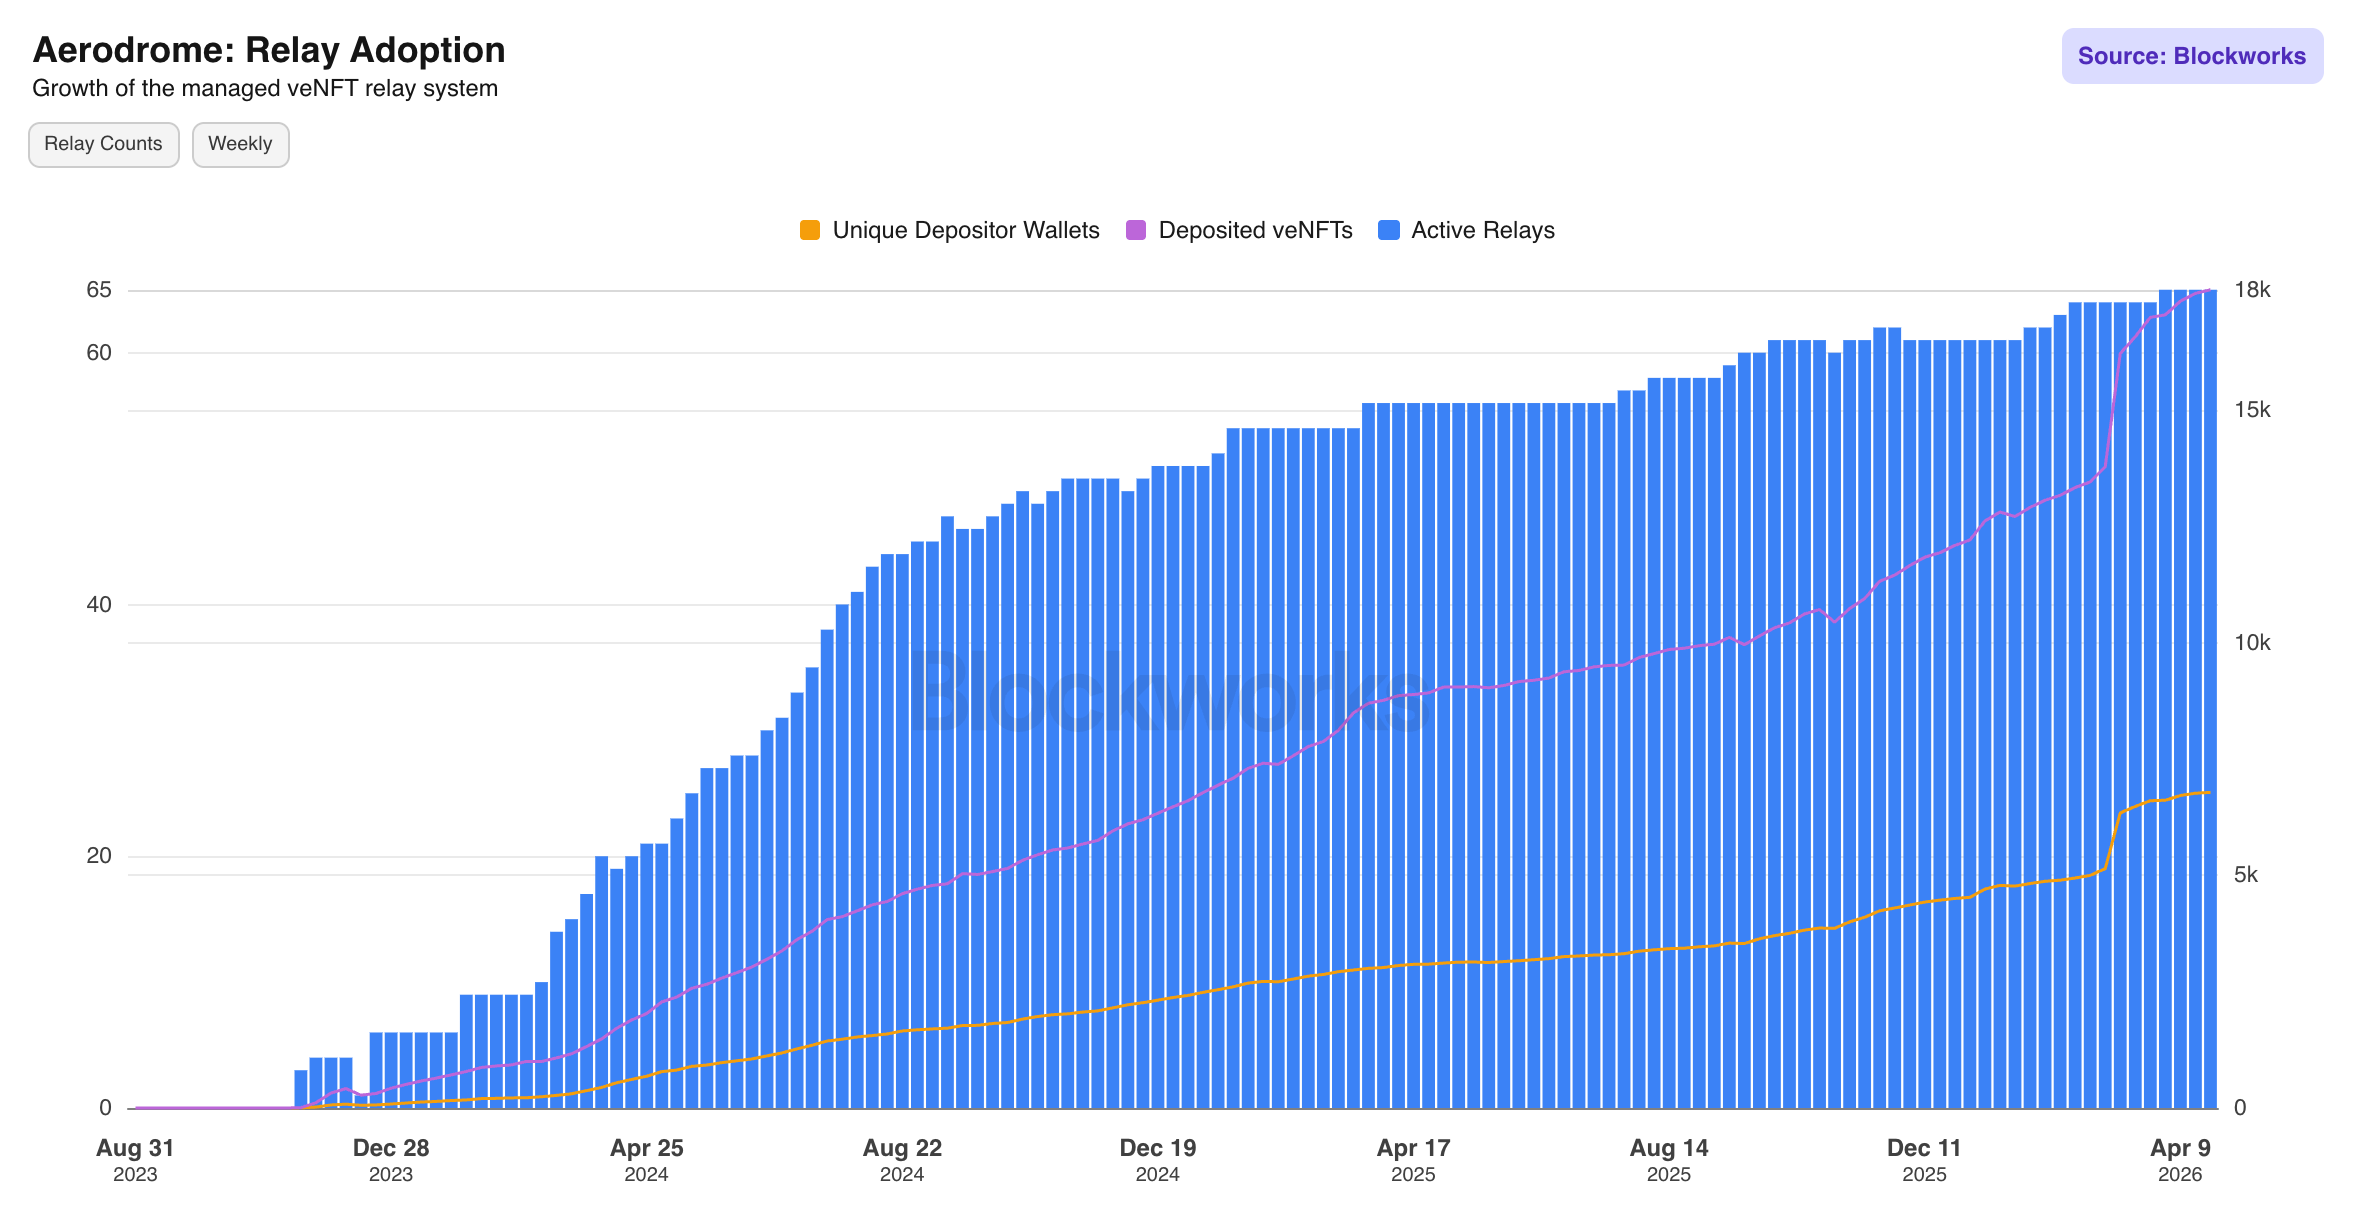
Relay Adoption: Relays are managed veNFT positions that pool voting power from multiple depositors under a single automated strategy, functioning similarly to a liquid staking wrapper for governance. The chart shows consistent growth in active relays, depositor wallets, and total onchain voting power directed through the relay system.
Spot Volume
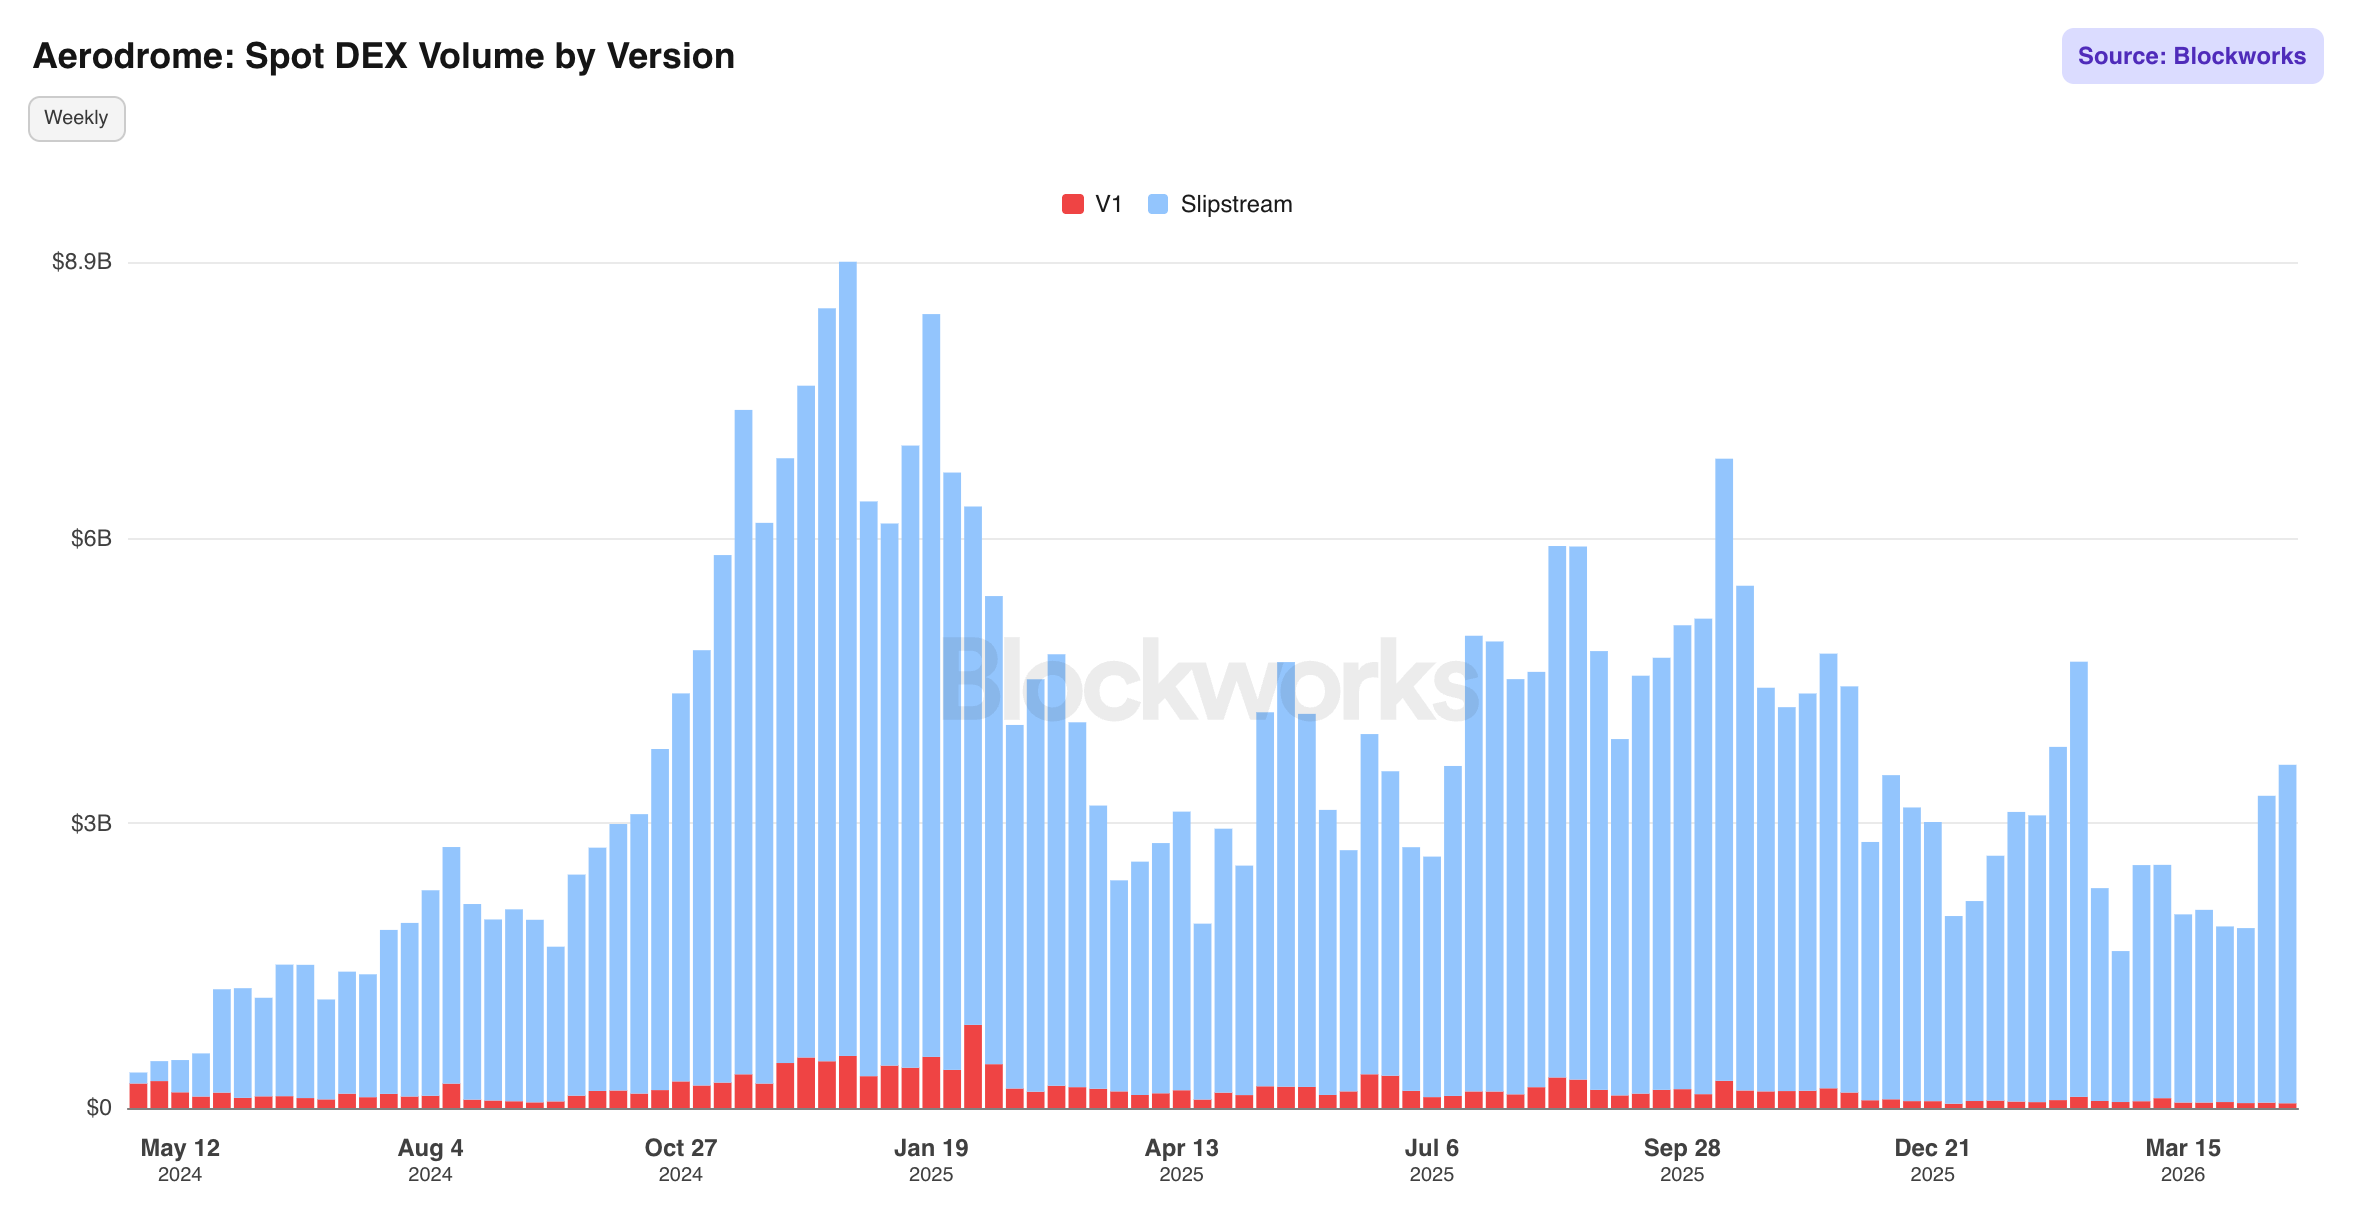
Spot DEX Volume by Version: Splits total volume between V1 and Slipstream pools. Slipstream now dominates the stack almost entirely, with V1 representing a thin sliver of total activity.
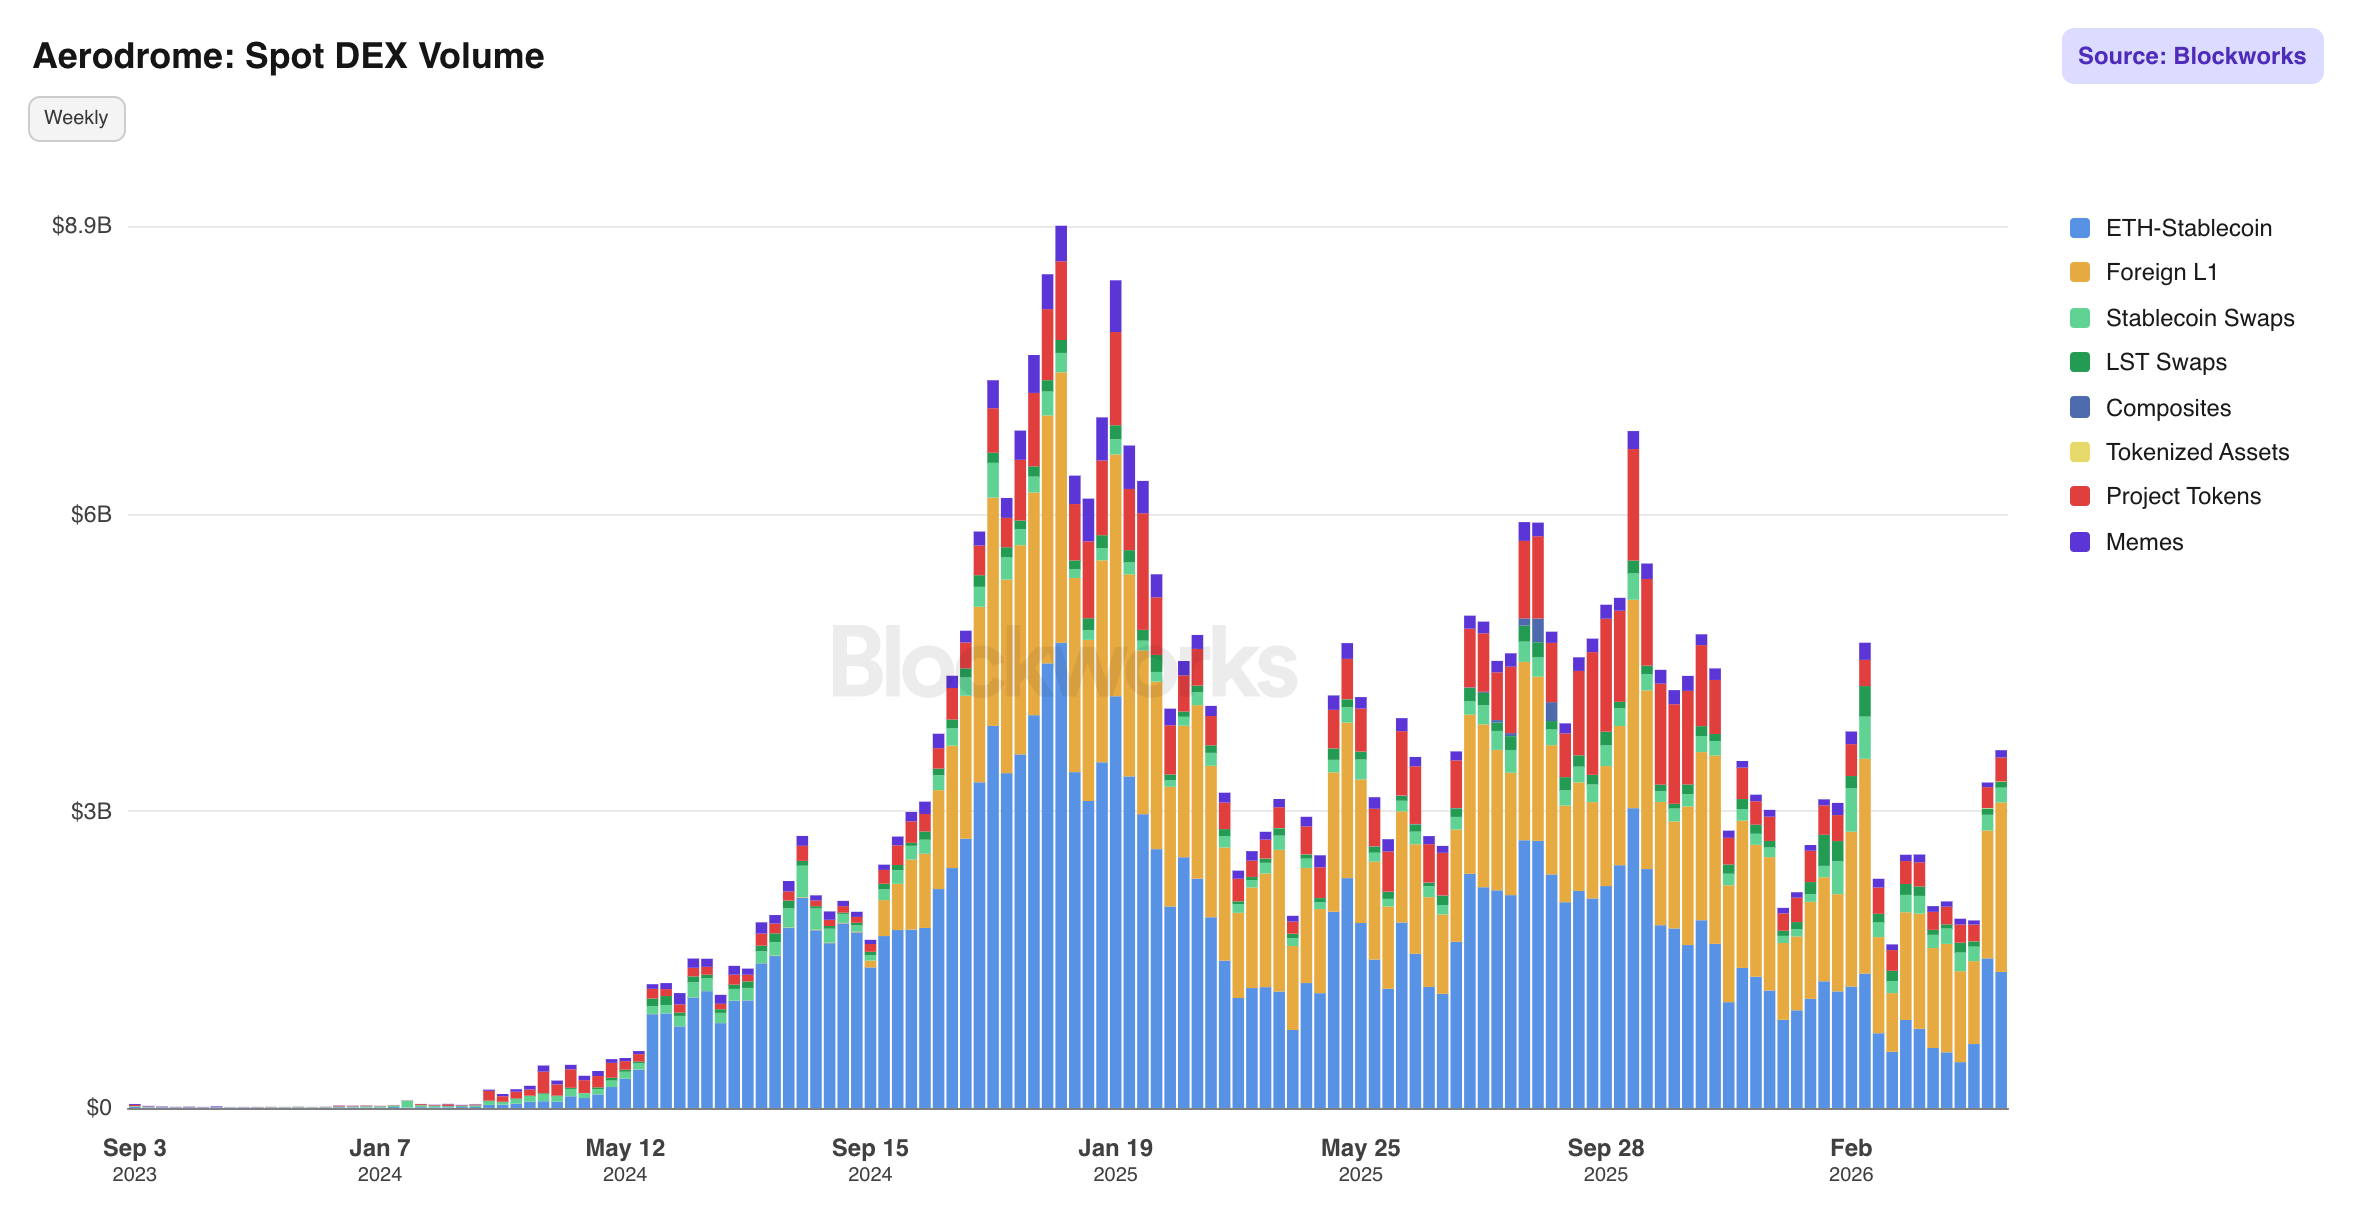
Spot DEX Volume: Category breakdowns tell an important story about volume composition. ETH-Stablecoin plus Foreign L1 volume consistently account for ~75-90% of total activity per the Percentage of Spot Volume from Majors chart.
Order Flow
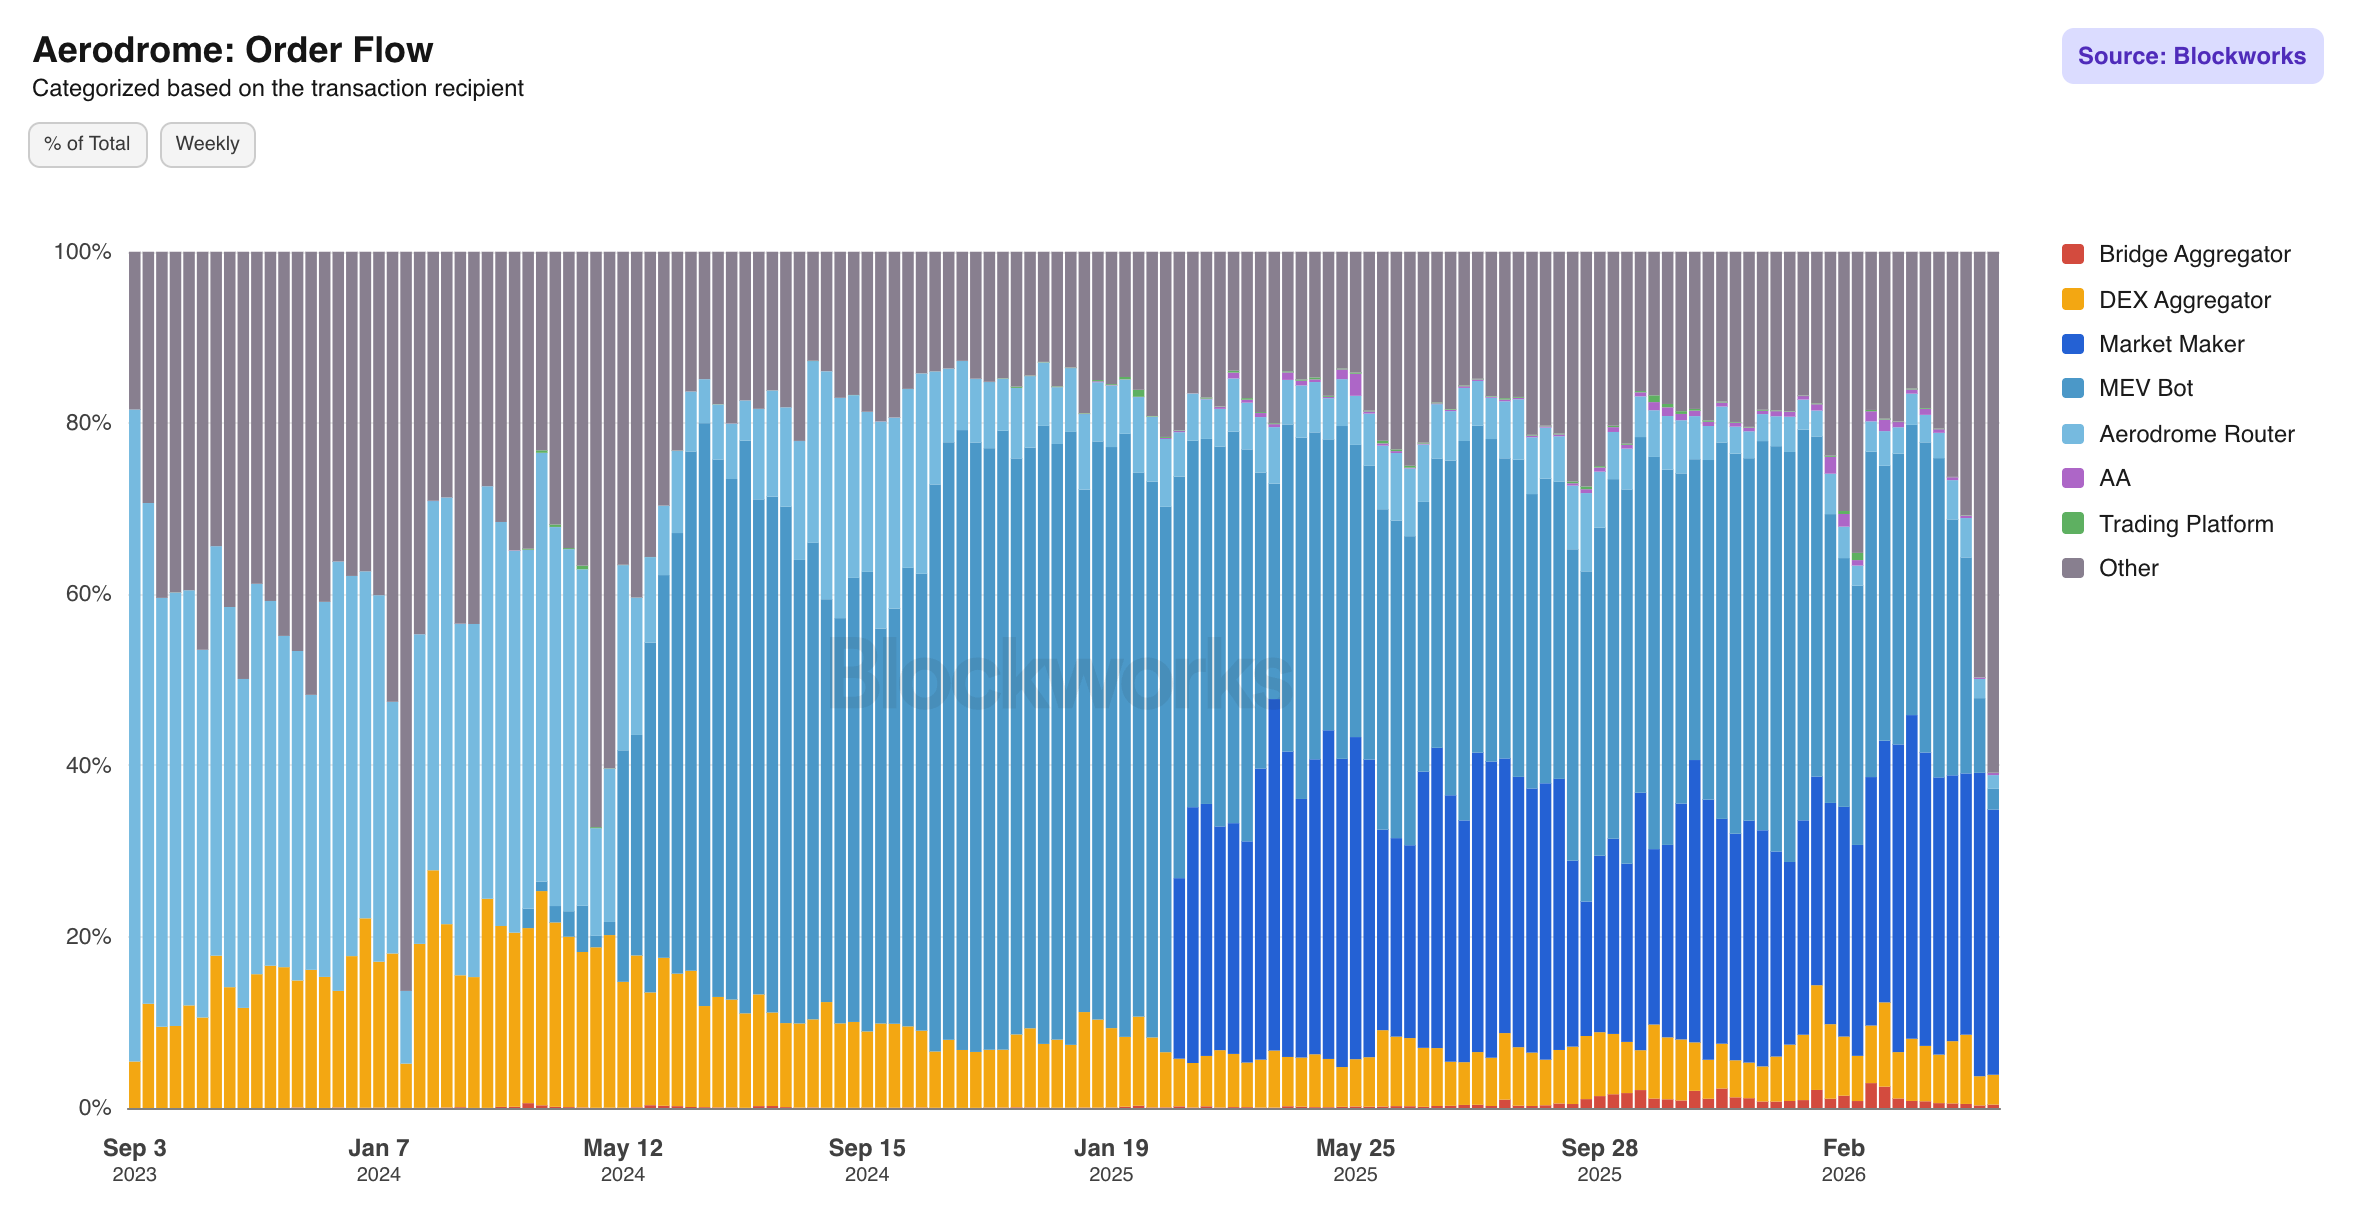
Order Flow: This stacked percentage chart categorizes all volume by transaction recipient. Market Makers and DEX Aggregators collectively dominate the stack, historically accounting for the majority of volume.
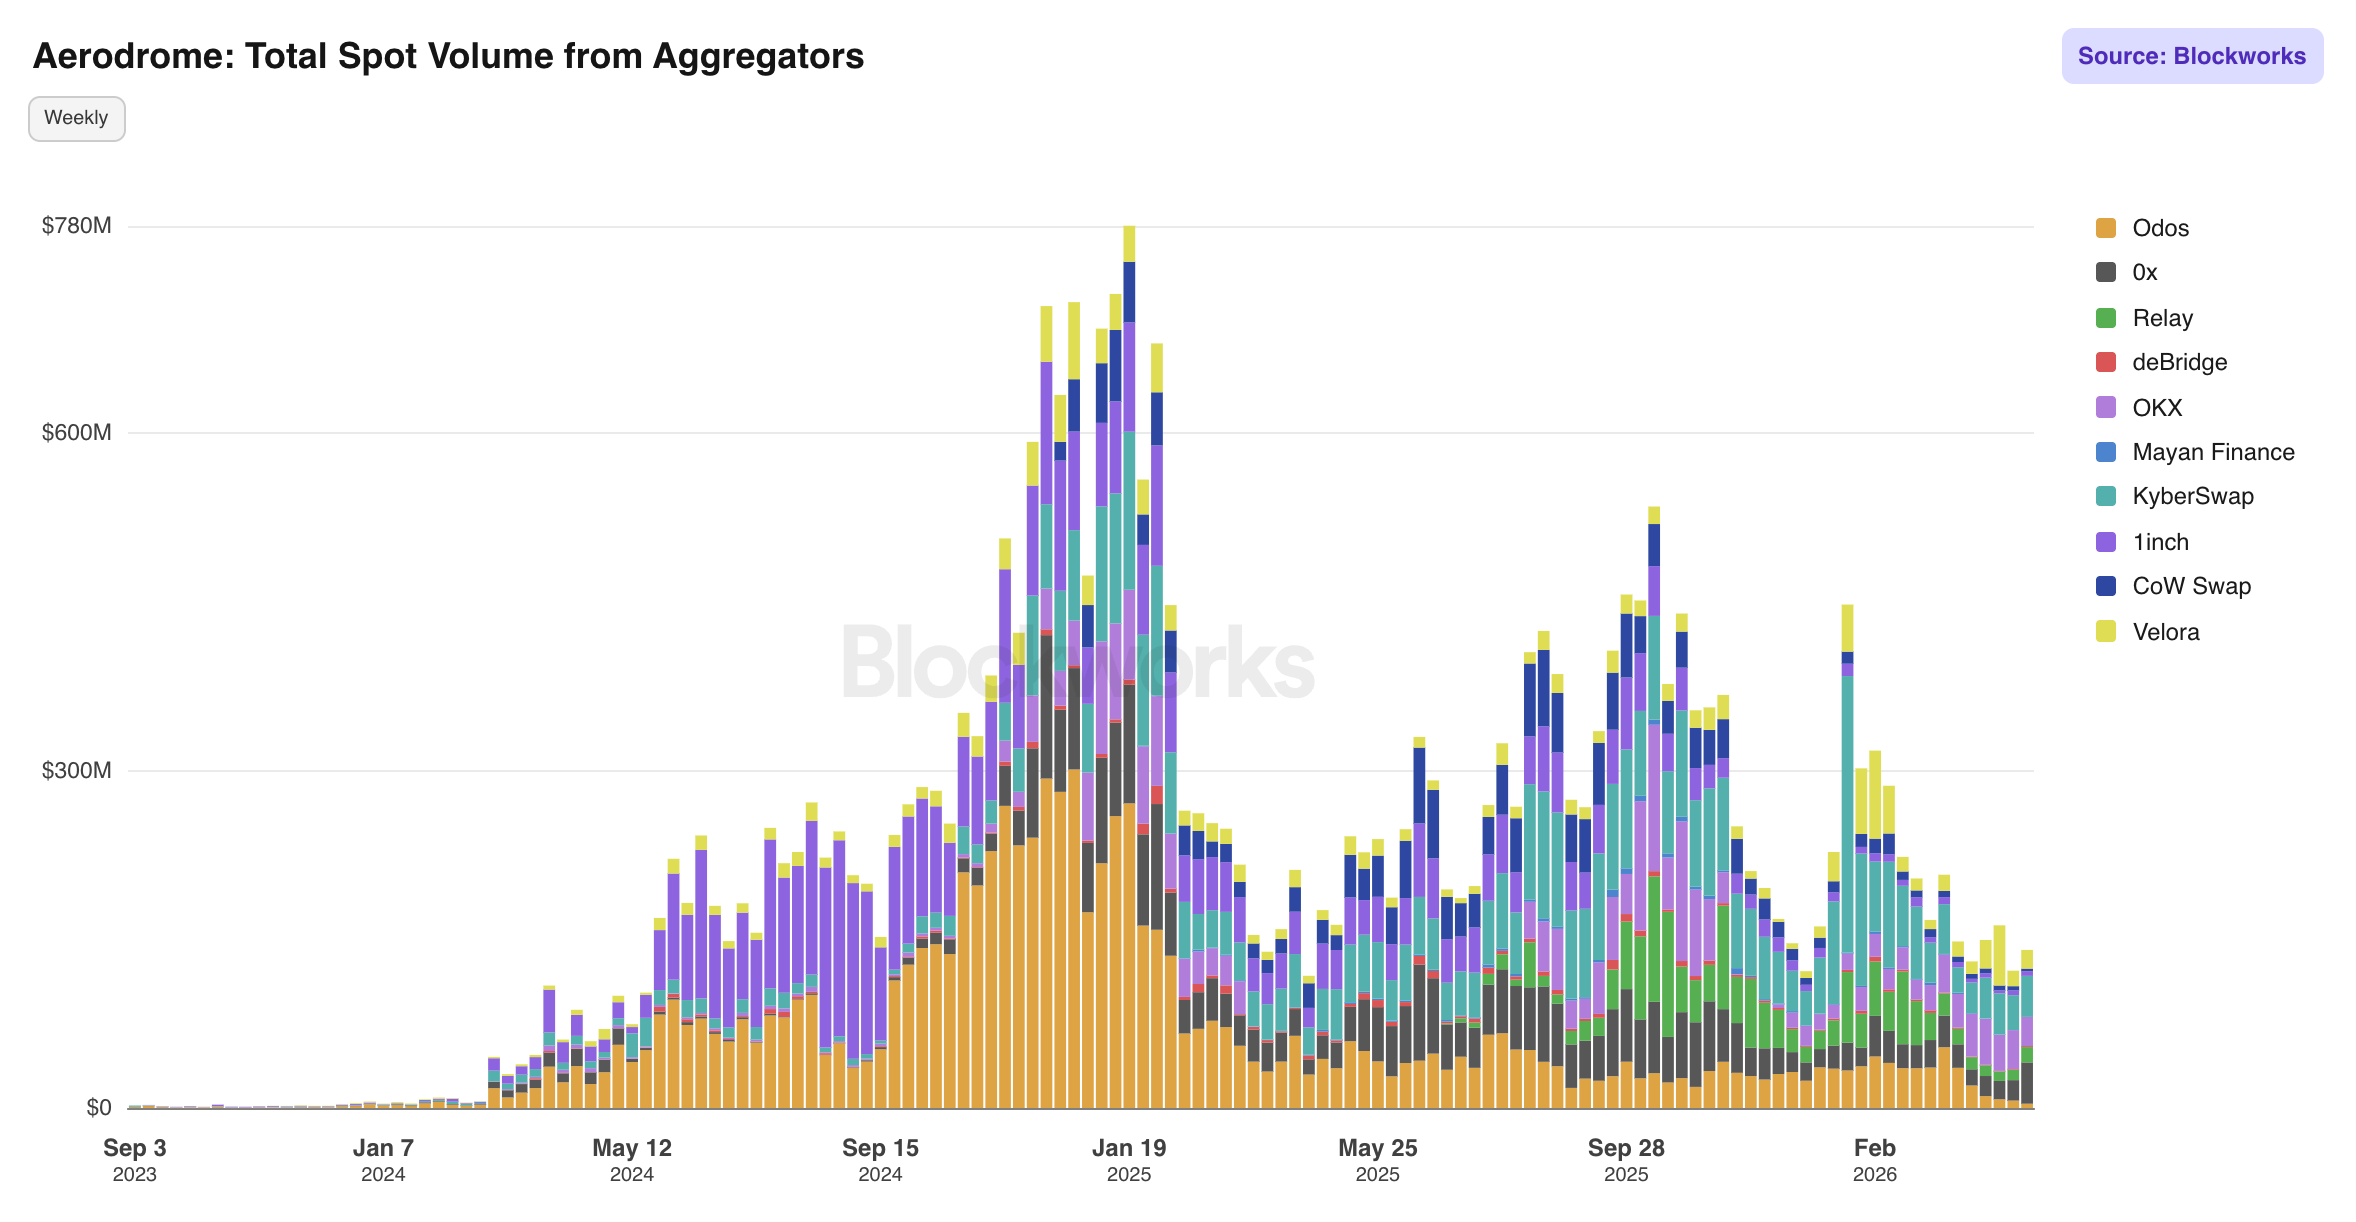
Total Spot Volume from Aggregators: Breaks aggregator volume down by source. A diversified aggregator mix is structurally positive as it indicates Aerodrome wins routing across multiple competing algorithms rather than being dependent on a single integrator relationship.
Traders
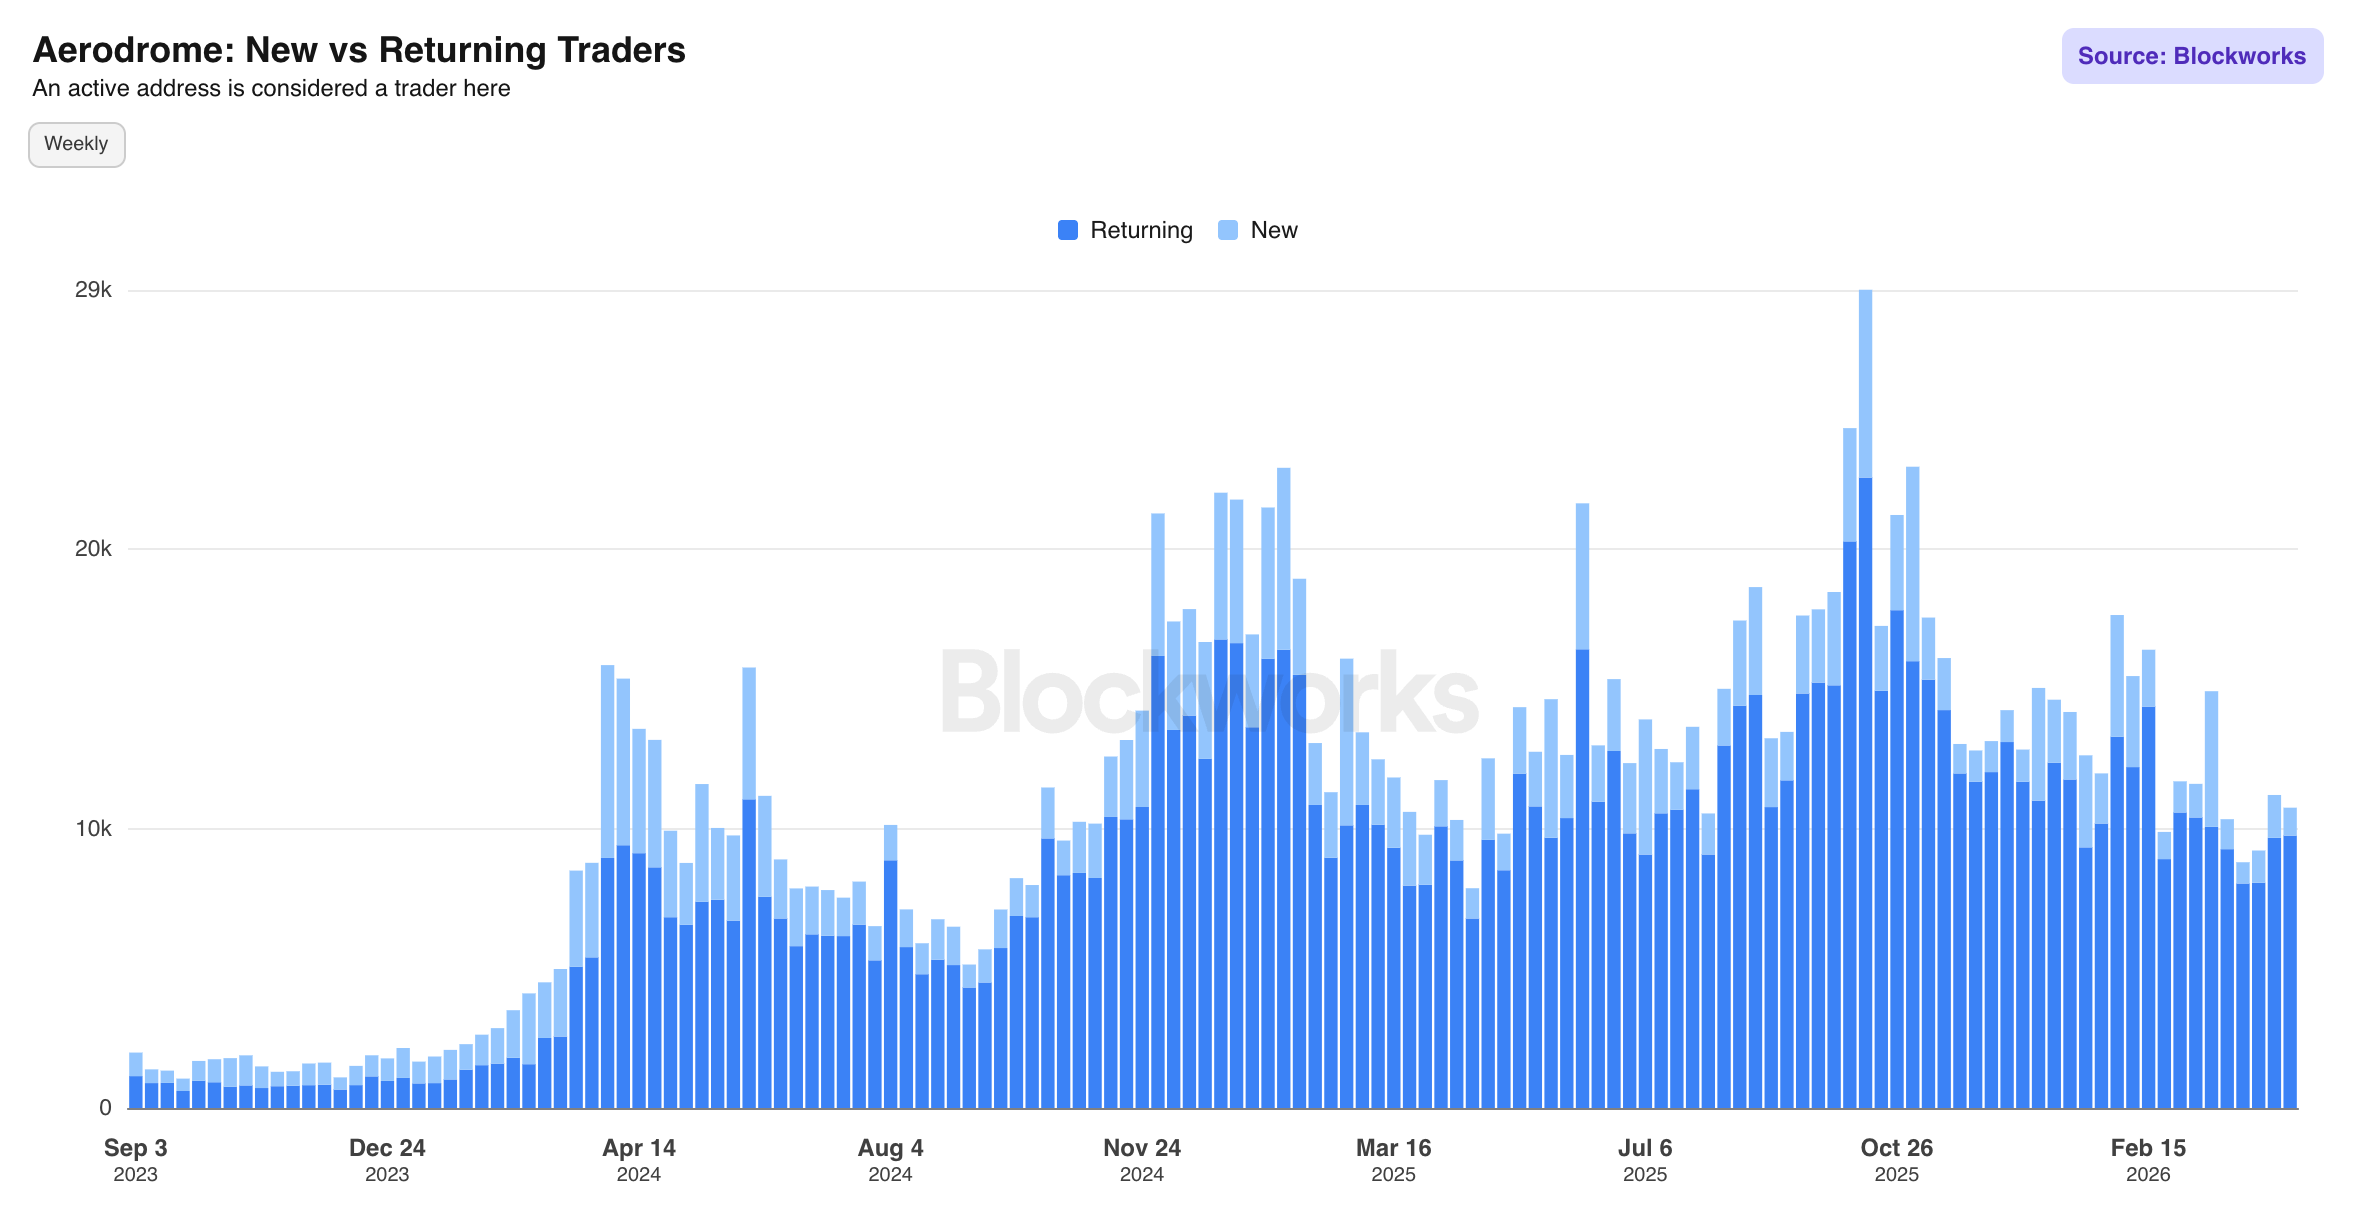
New vs Returning Traders: 91% of the current active base are classified as returning traders, with a total active trader count above 11K. The consistently dominant returning share across all market conditions signals genuine habitual usage rather than event-driven spikes.
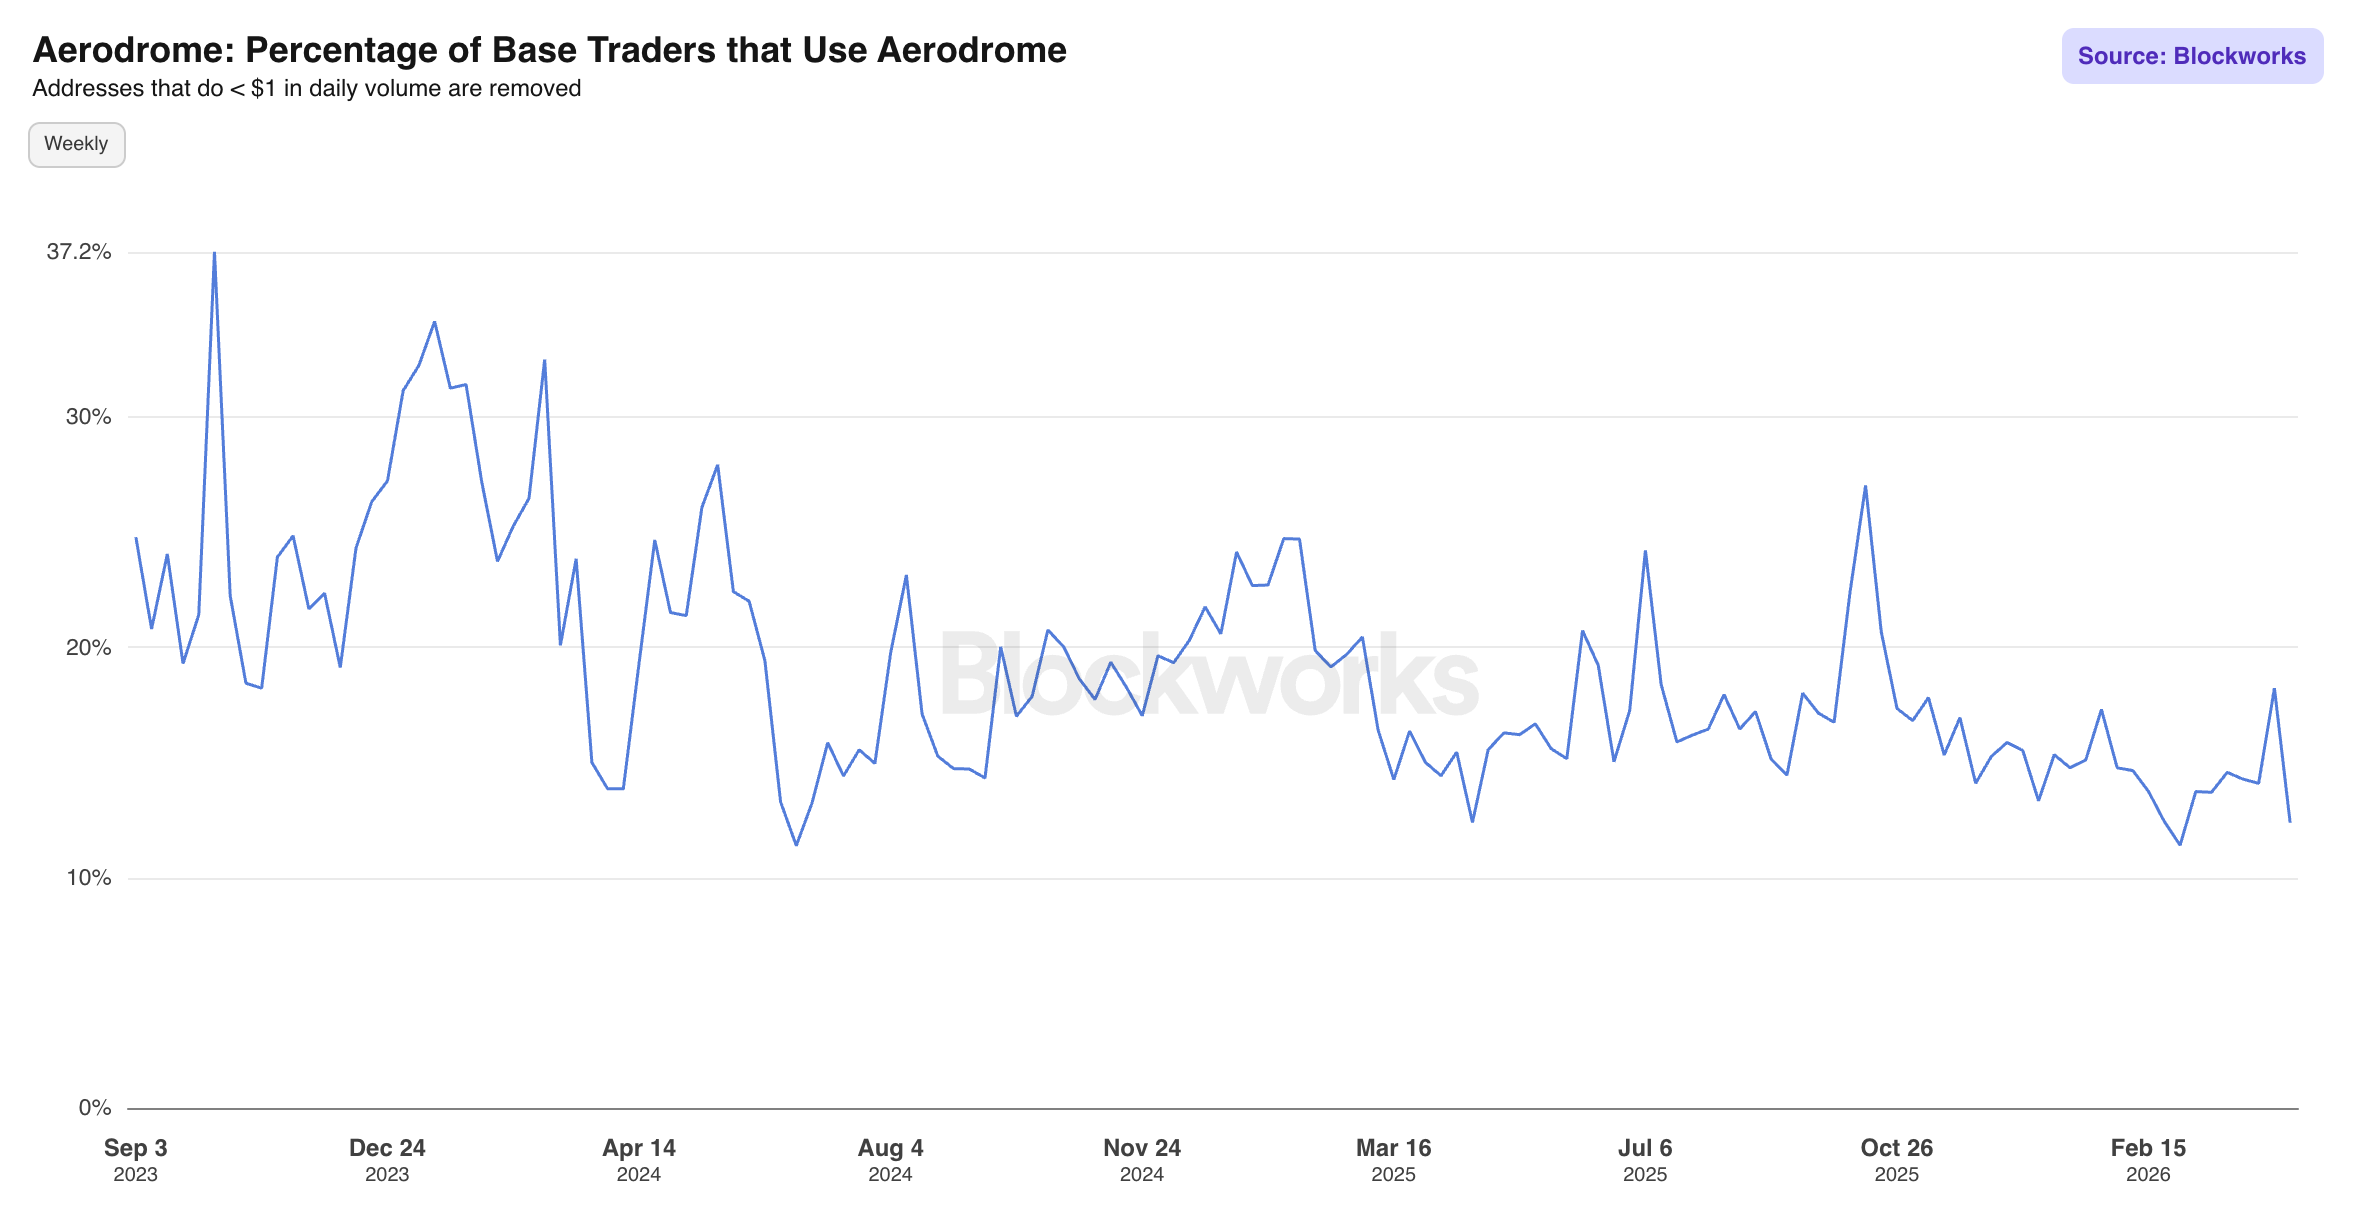
Percentage of Base Traders that Use Aerodrome: Tracks Aerodrome's share of total active Base traders. The share has ranged between ~12-28%, with a current reading in the low-to-mid teens.
Liquidity
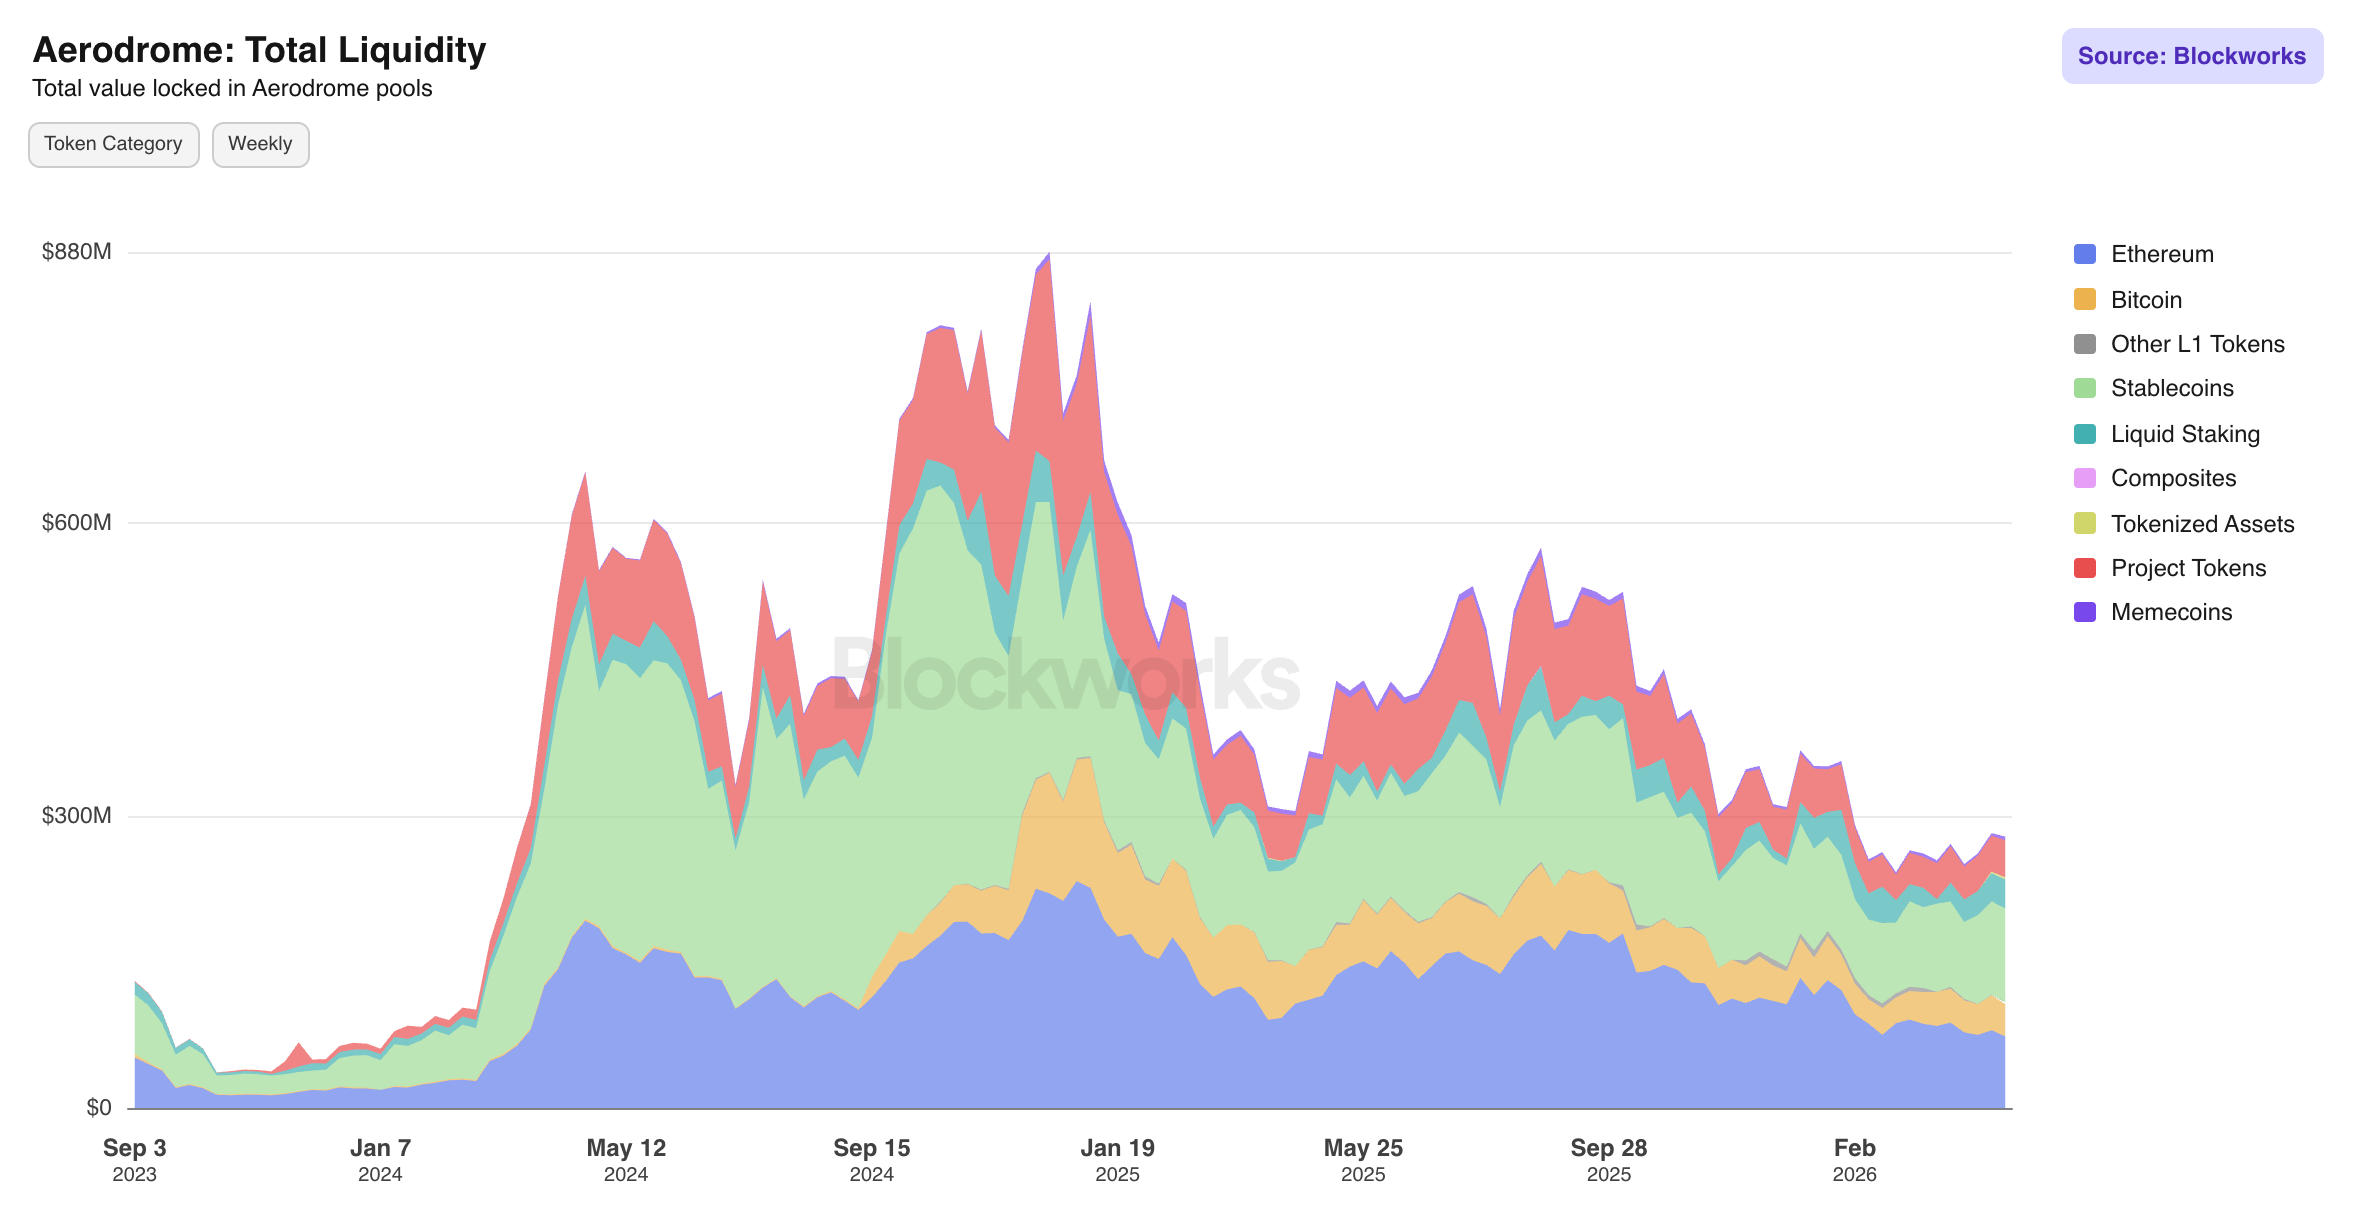
Total Liquidity: Breaks TVL into token categories. Current TVL sits at $240M, down significantly from the ~$880M peak in Dec. 2024. Stablecoins represent 35% of total liquidity, providing a durable base relatively insensitive to price volatility.
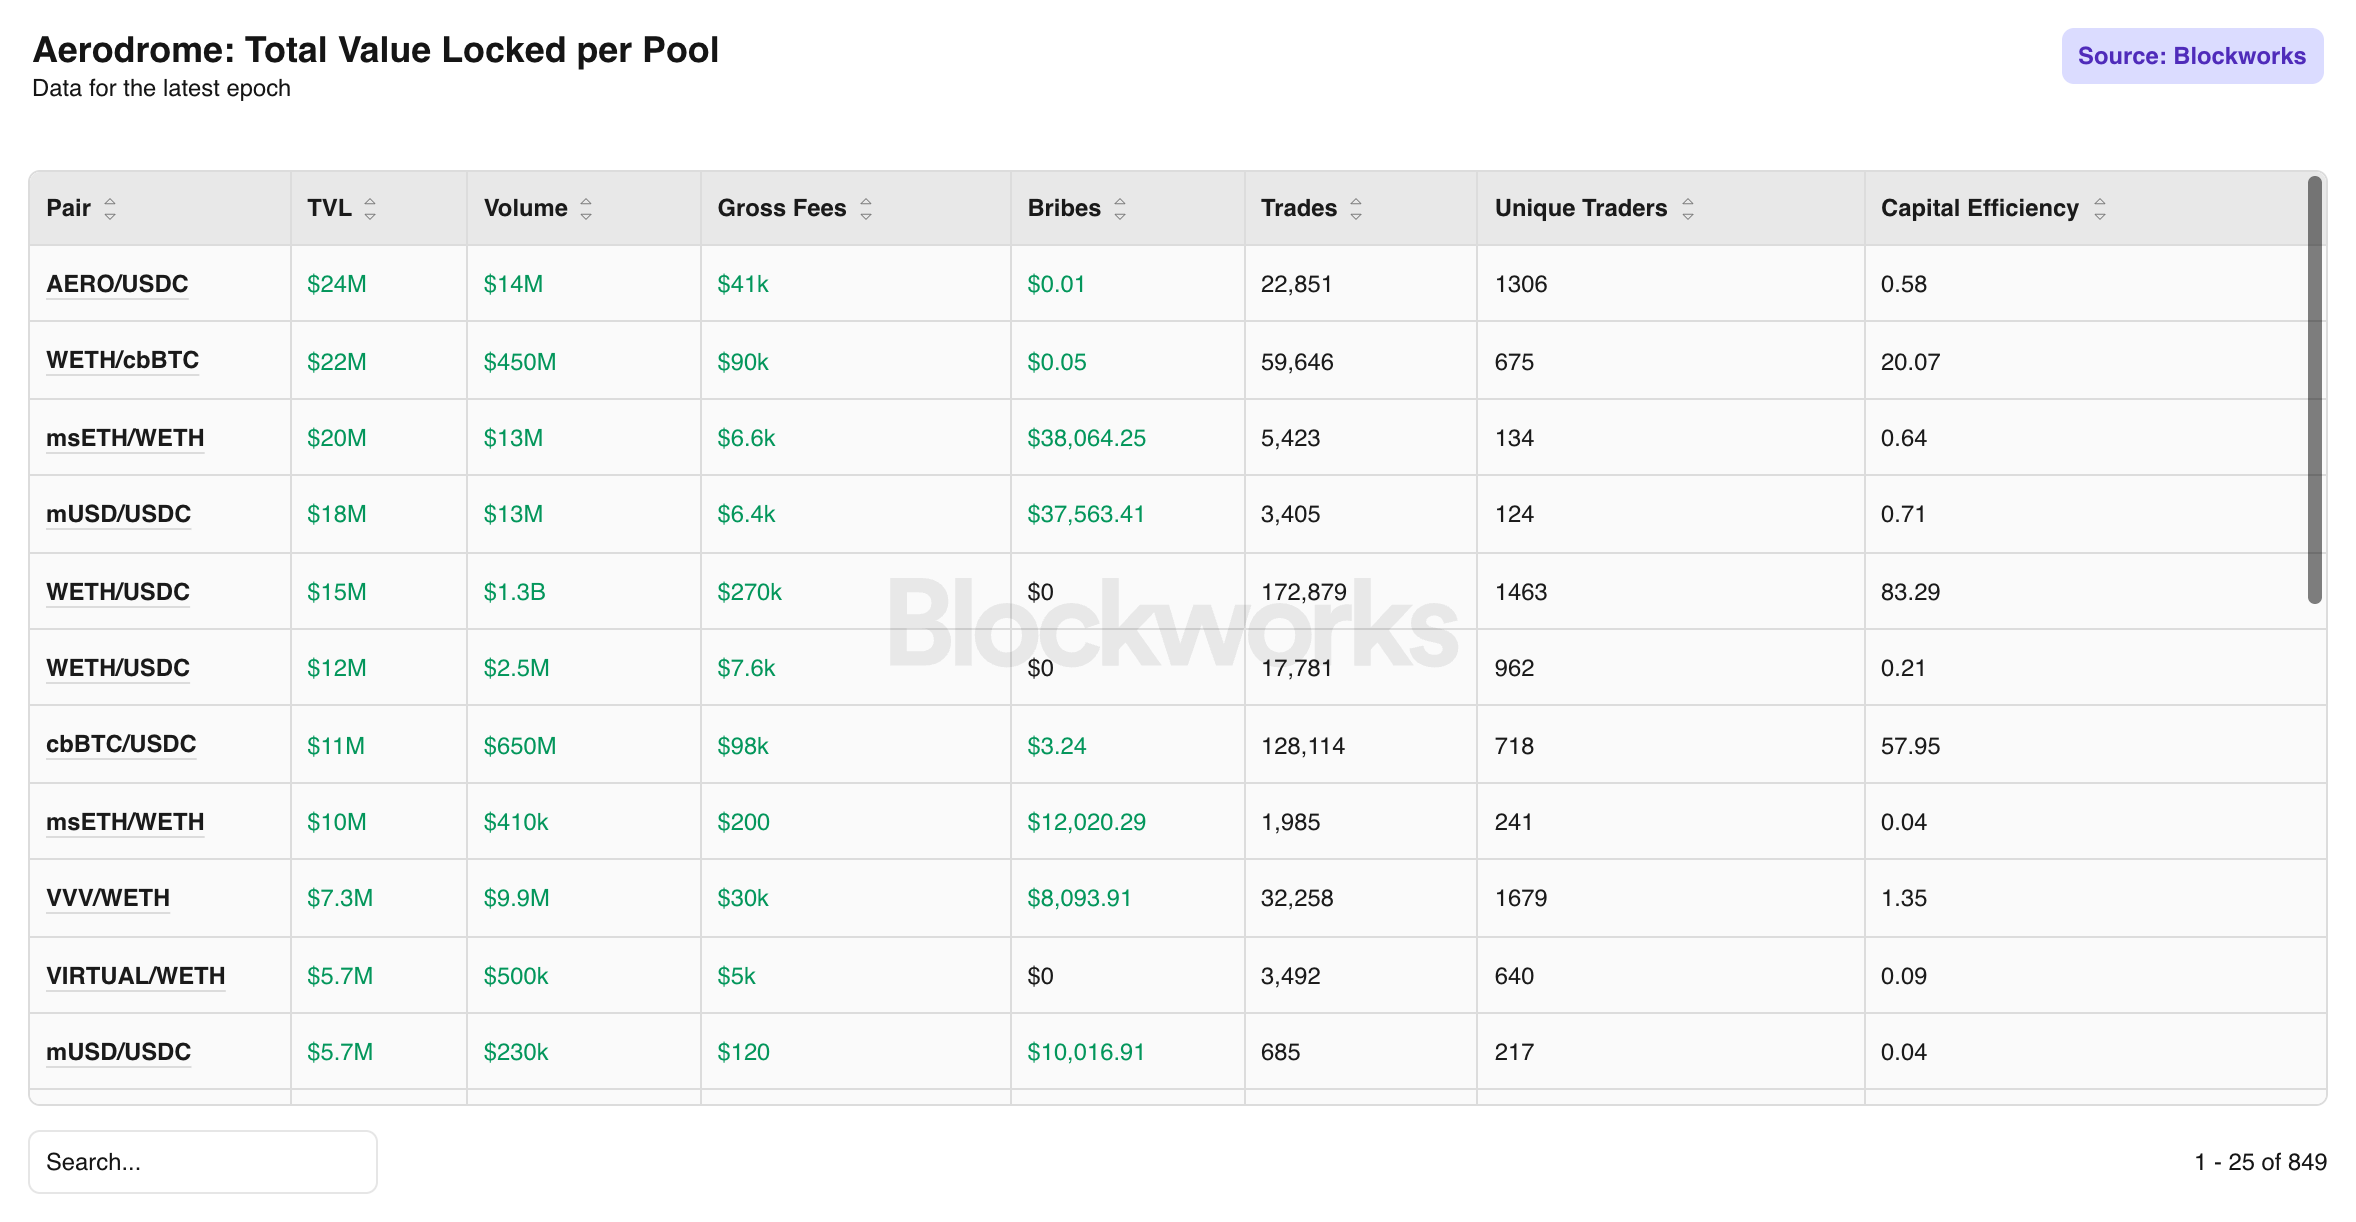
Total Value Locked per Pool: Surfaces TVL, volume, gross fees, bribes, trade count, unique traders, and a Capital Efficiency score per pool for the latest epoch. The Capital Efficiency column, defined as volume divided by TVL, is the standout metric. WETH/USDC registers a capital efficiency of 83.29.
Ignition
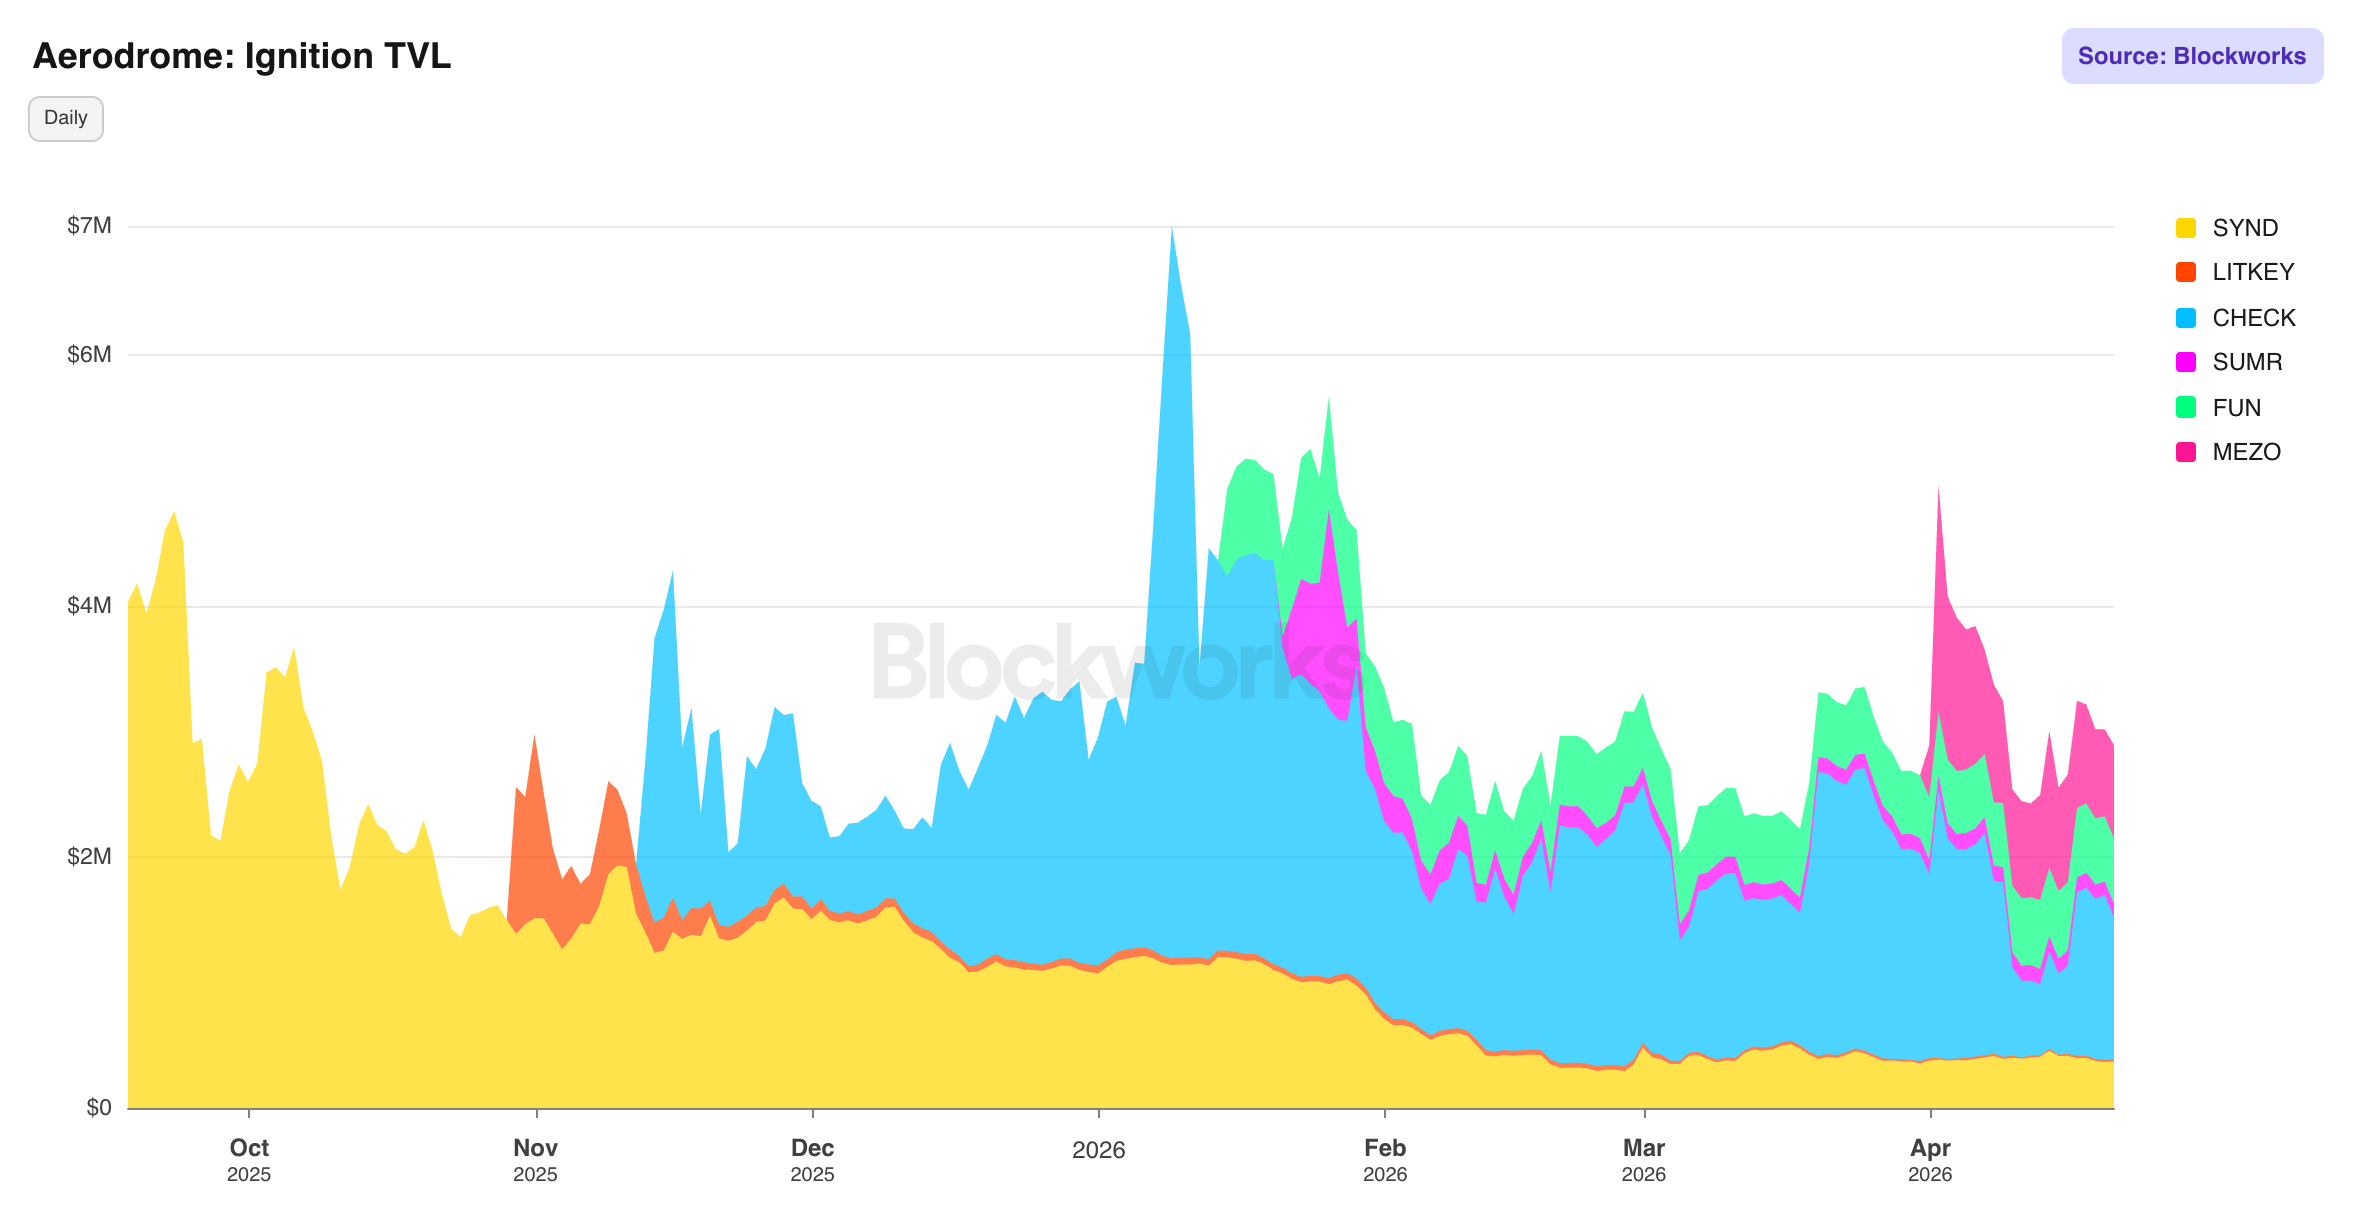
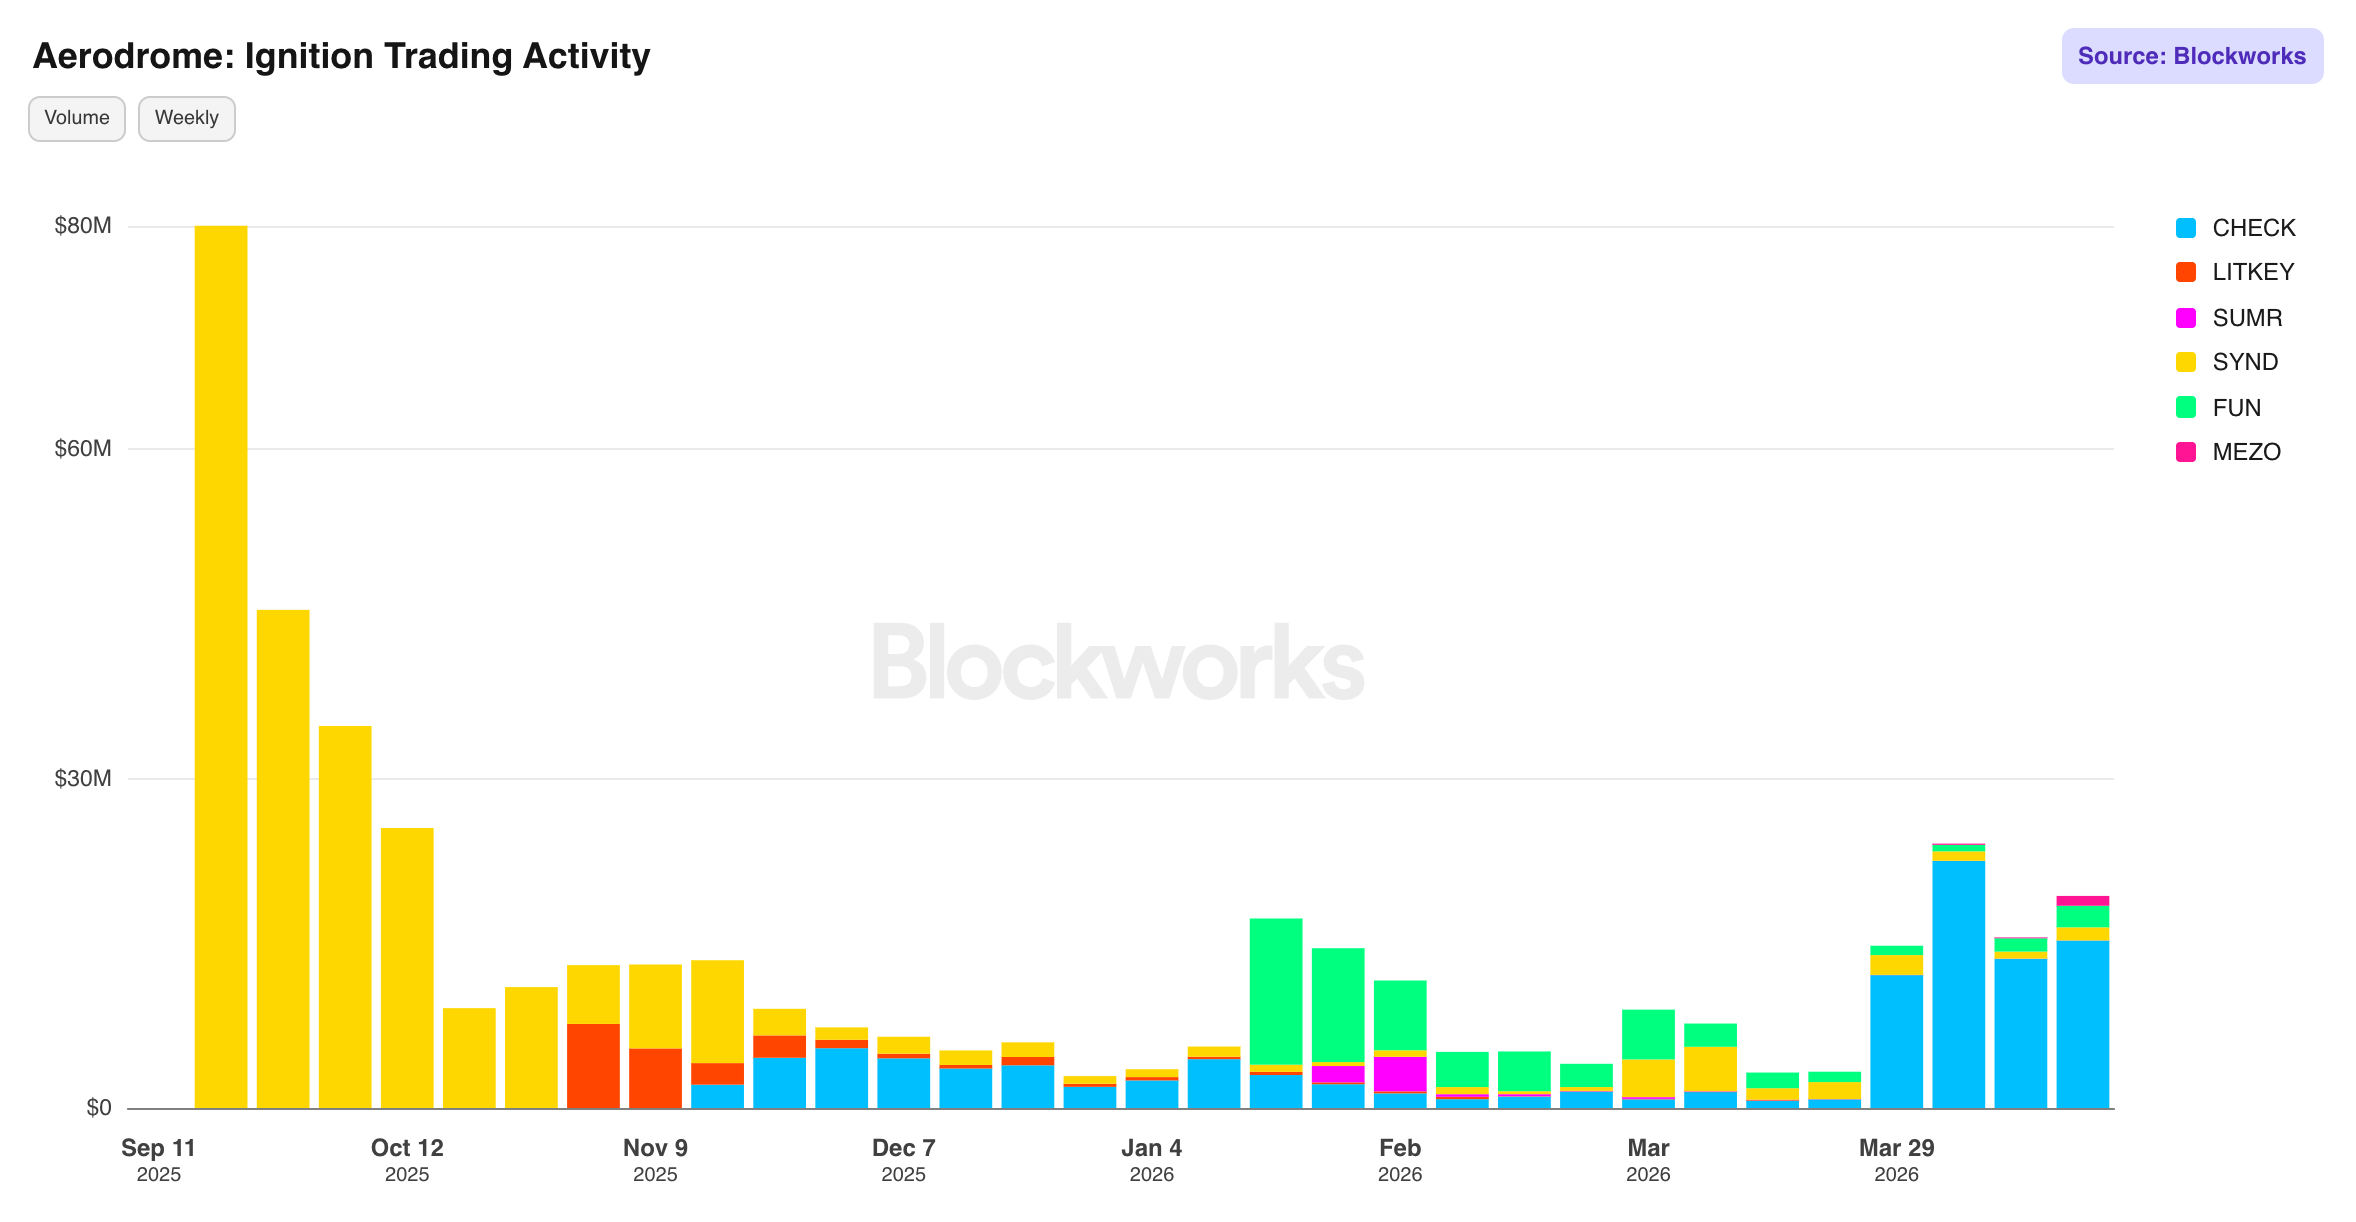
Ignition TVL and Ignition Trading Activity: Two companion charts tracking TVL and volume across active Ignition launches. CHECK dominates both TVL and trading activity, with its token showing the only meaningful sustained price appreciation.
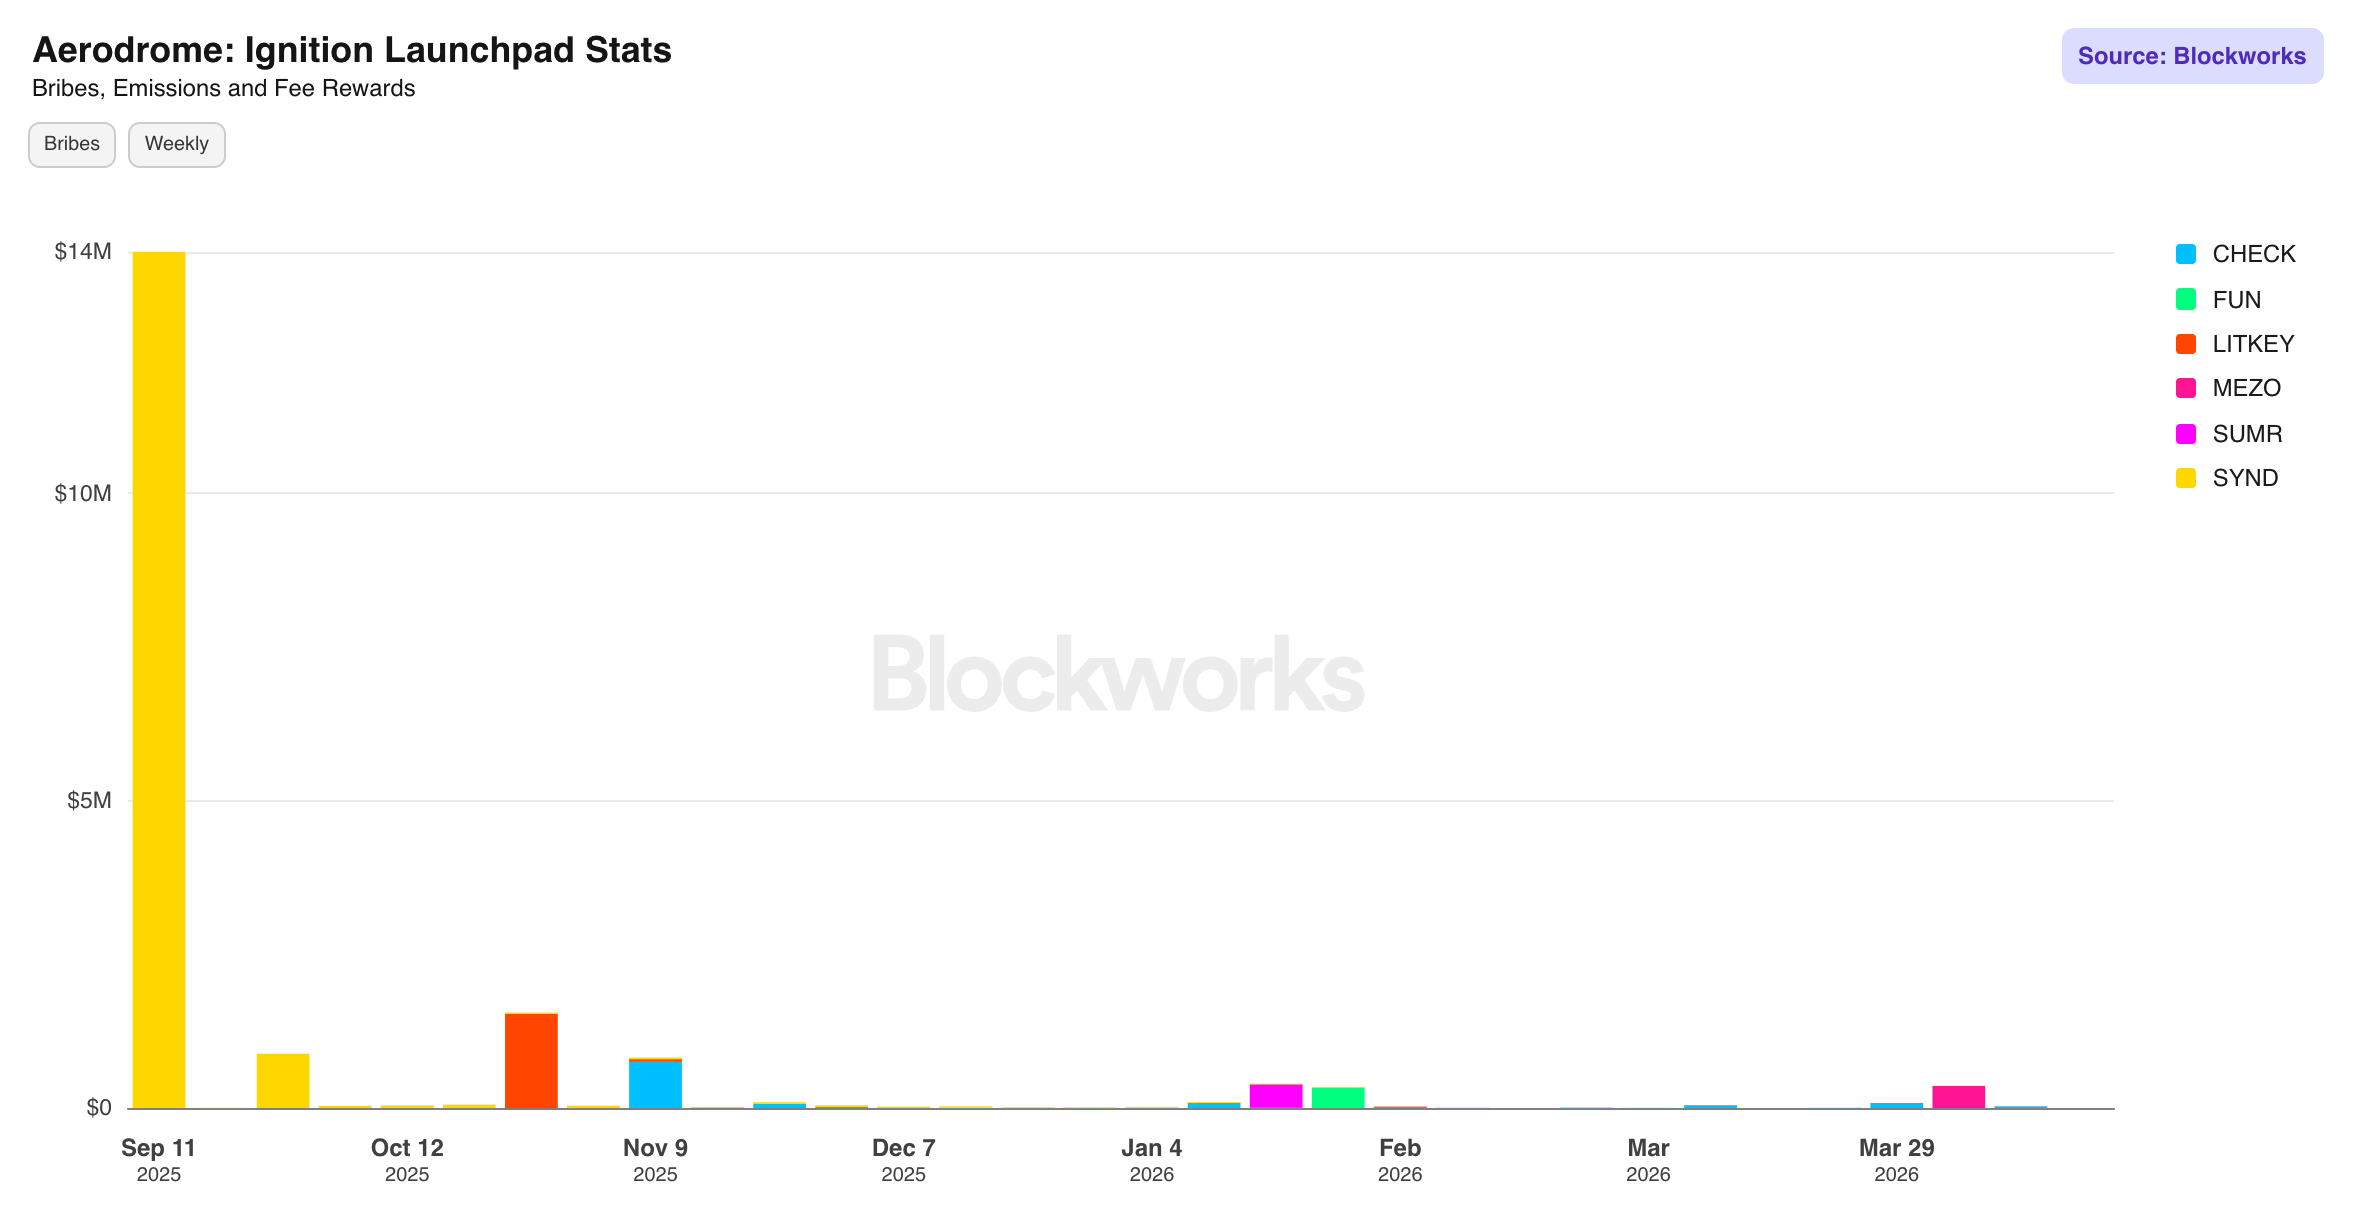
Ignition Launchpad Stats: Tracks bribes, emissions, and fee rewards per project. SYND generated the largest single-week bribe spend near launch (~$14M), dwarfing all other projects.
Competitive Landscape
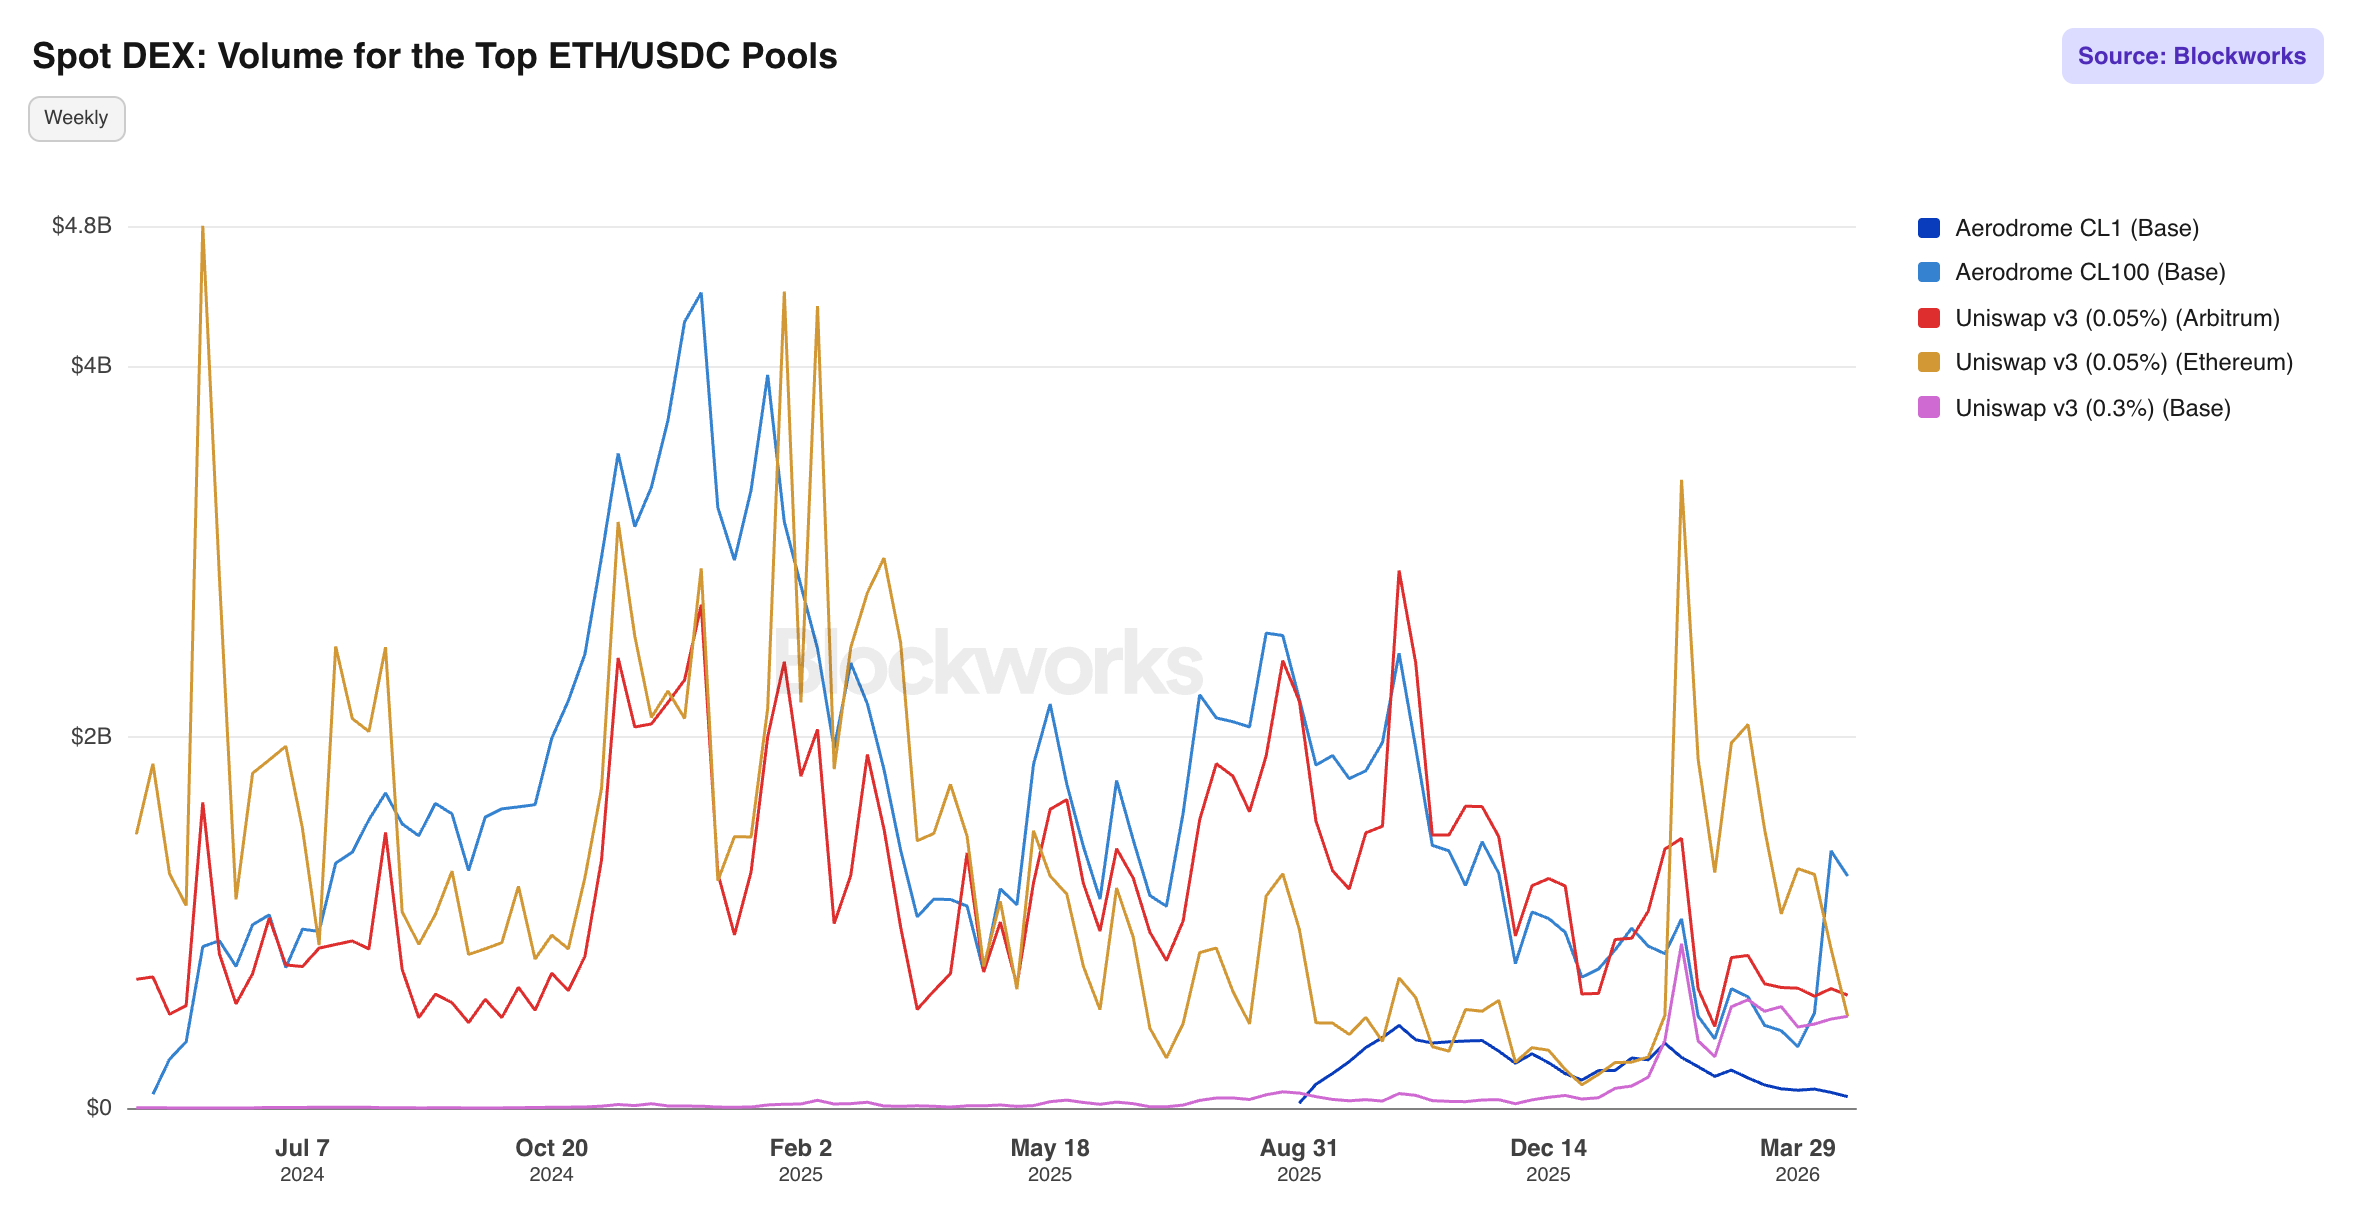
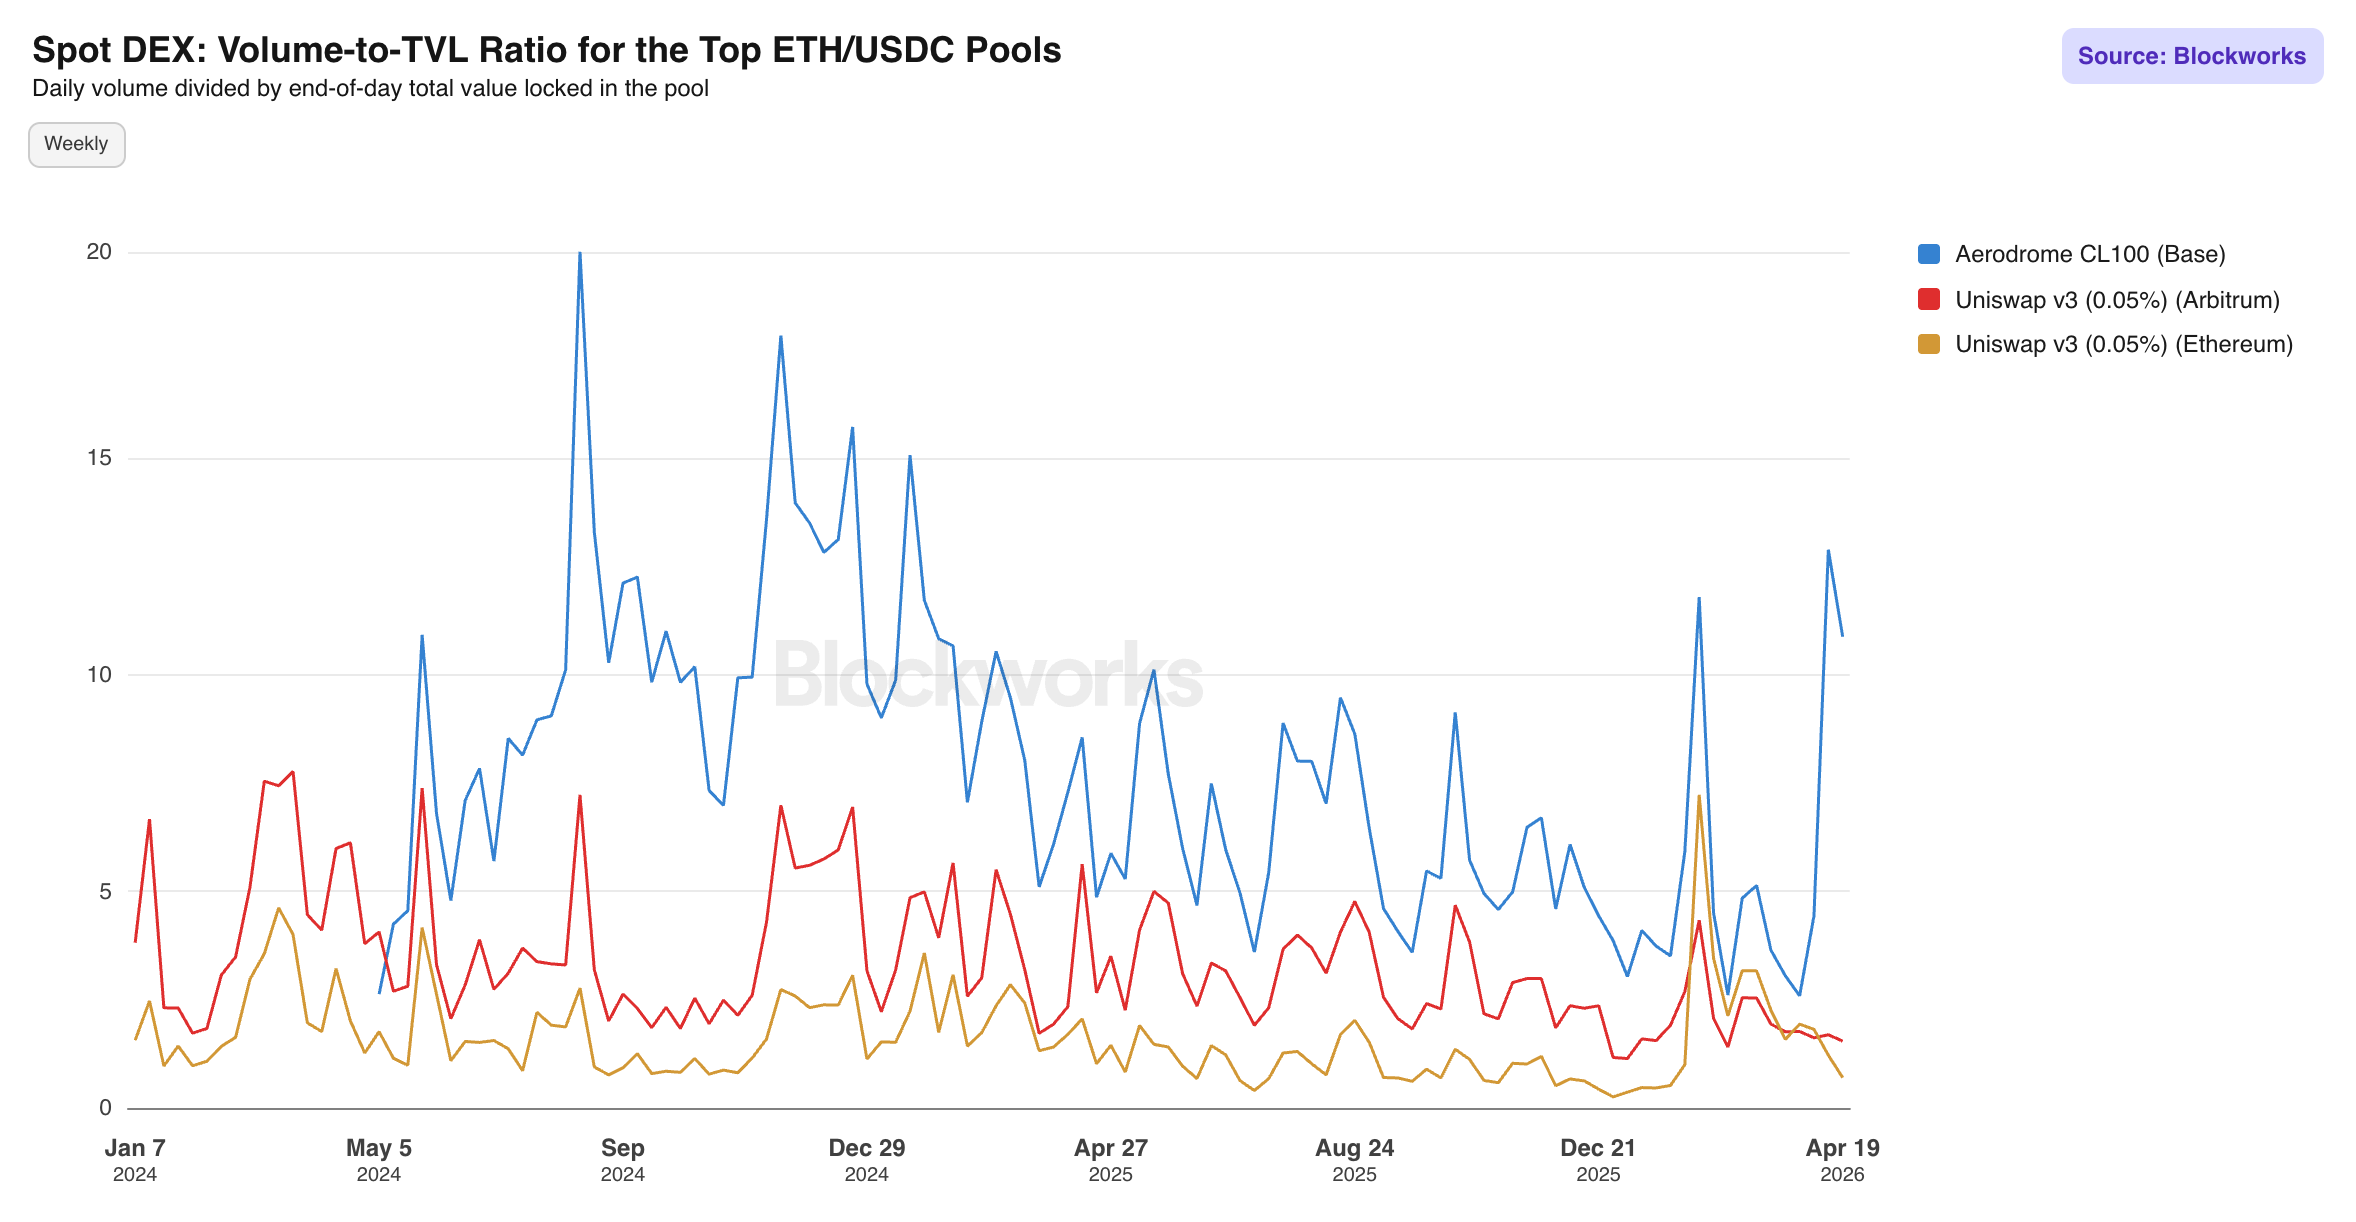
Volume for the Top ETH/USDC Pools: Compares volume across the leading ETH/USDC venues including Aerodrome CL1 and CL100 on Base, and Uniswap v3 on Arbitrum, Ethereum and Base.
Volume-to-TVL Ratio for the Top ETH/USDC Pools: Aerodrome’s competitive efficiency benchmark. CL100 on Base has consistently posted volume-to-TVL ratios well above Uniswap's equivalent pools on both Ethereum and Arbitrum, peaking above 26x.
The information contained in this report and by Blockworks Inc. and related affiliates is for general informational purposes only and is not intended to provide legal, financial, or investment advice. The report should not be construed as an offer or solicitation to buy or sell any security, token, or financial instrument and does not represent any recommendation or endorsement of any investment or financial product or service. Blockworks Inc. and related affiliates are not registered as a securities broker-dealer or an investment advisor in any jurisdiction or country.
Back to Insights
Newsletter
The Breakdown
Decoding crypto and the markets. Daily, with Byron Gilliam.
Blockworks Research
Unlock crypto's most powerful research platform.
Our research packs a punch and gives you actionable takeaways for each topic.
Blockworks Inc.
133 W 19th St., New York, NY 10011
Blockworks Network