Insights / Risk Management
Ethena Gold Basis Trading Portfolio Performance Analysis
This report provides a quantitative characterisation of perpetual futures funding rate dynamics for tokenised gold (PAX Gold PAXG and Tether Gold XAUT) and their relationship to Ethena's existing BTC and ETH basis book. It is an analytical contribution to the Risk Committee's broader consideration of gold backed instruments, offering the empirical foundation on which portfolio and risk decisions can rest.
By Blockworks Advisory ·
This report provides a quantitative characterisation of perpetual futures funding rate dynamics for tokenised gold (PAX Gold PAXG and Tether Gold XAUT) and their relationship to Ethena's existing BTC and ETH basis book. It is an analytical contribution to the Risk Committee's broader consideration of gold backed instruments, offering the empirical foundation on which portfolio and risk decisions can rest.
The central finding is that gold and crypto perpetual funding rates are near uncorrelated. BTC-PAXG Pearson correlation is 0.014 and BTC-XAUT is 0.020 over the overlap window. The rolling structure shows that over 12 months the sign of the relationship switches repeatedly. A 2 state Hidden Markov Model applied to the BTC funding series identifies a compressed carry regime (38.8% of days, mean BTC carry 1.4% per annum) during which XAUT averaged 12.3% annualised and PAXG 6.8%. These levels are economically meaningful against a near zero BTC carry backdrop. The direction of this counter cyclicality is consistent with the diversification hypothesis, though the formal statistical test for PAXG does not reach significance and for XAUT sits at the boundary (given only 144 low regime observations).
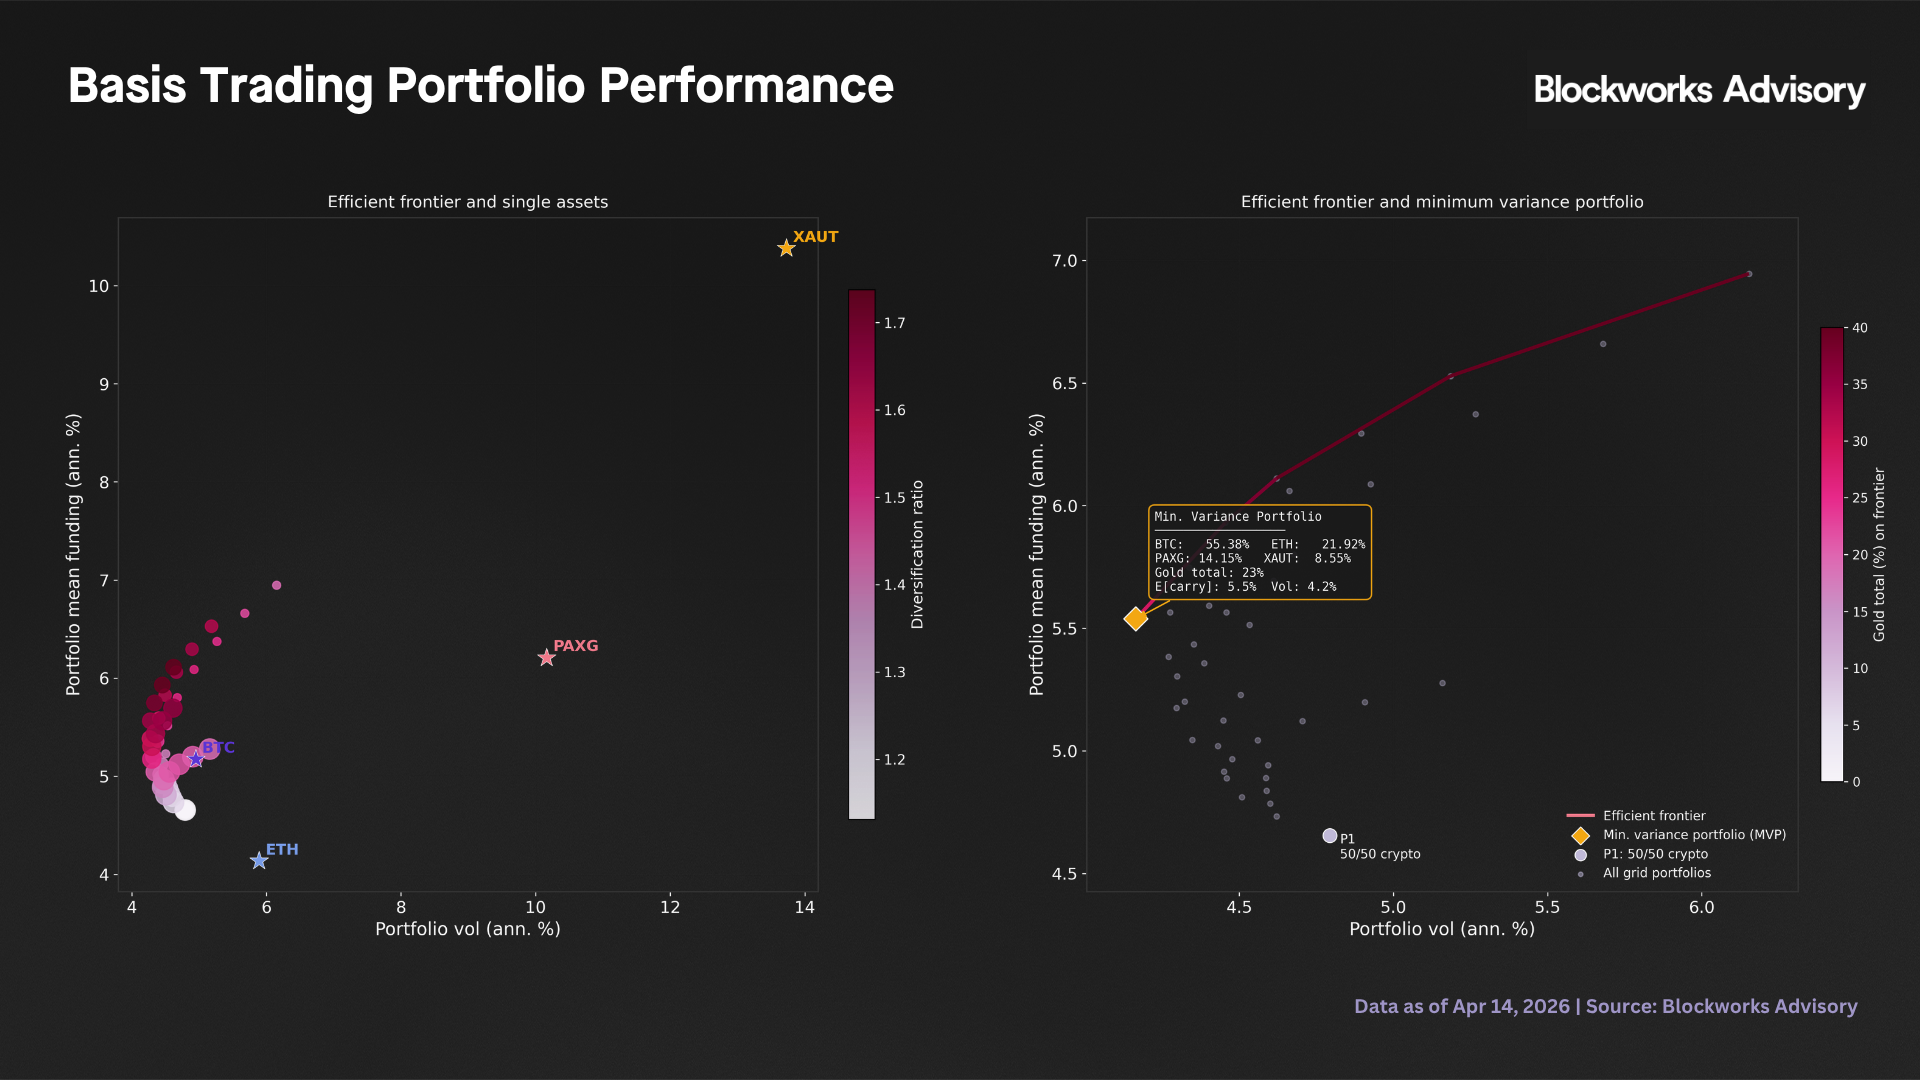
Following the correlation structure, the portfolio implication is that adding 10-20% total gold allocation to an equal weight BTC-ETH baseline reduces portfolio carry volatility, improves mean carry and raises all risk adjusted metrics simultaneously. This combination is only possible because the added assets are nearly orthogonal to the existing book. The minimum variance portfolio (55% BTC, 22% ETH, 14% PAXG, 9% XAUT) achieves 4.16% annualised carry volatility (13% below the crypto only baseline) while delivering mean carry of 5.54%, 88 basis points above it.
From the risk perspective, raw daily funding volatility for gold is two to three times that of BTC and ETH, driven by structurally thinner markets. CVaR at the 5th percentile is -33.1% per annum for PAXG and -12.8% for XAUT, substantially more severe than the -7.9% for the baseline crypto portfolio. These figures are what should drive Reserve Fund sizing since they reflect the actual settlement level tail.
| Metric | BTC | ETH | PAXG | XAUT |
|---|---|---|---|---|
| Mean carry (ann. %) | 5.2% | 4.1% | 5.8% | 12.4% |
| Carry volatility (ann. %) | 5.0% | 5.9% | 13.3% | 16.1% |
| % positive carry days | 88.1% | 84.6% | 82.1% | 88.9% |
| VaR 5% (ann. %) | -3.2% | -5.8% | -15.9% | -4.0% |
| CVaR 5% (ann. %) | - | - | -33.1% | -12.8% |
| Sign flip frequency | 10.8% | 16.8% | 23.3% | 21.9% |
| Correlation with BTC | 1.00 | 0.56 | 0.01 | 0.02 |
Data and methodology
Funding rate data is sourced across Binance, Bybit, OKX, Bitget and Coinbase. For BTC and ETH, the dataset contains 190,426 and 187,451 settlement records respectively spanning January 2020 to April 2026. Gold data covers 12 (exchange, symbol) pairs after filtering to PAXG and XAUT on eligible venues.
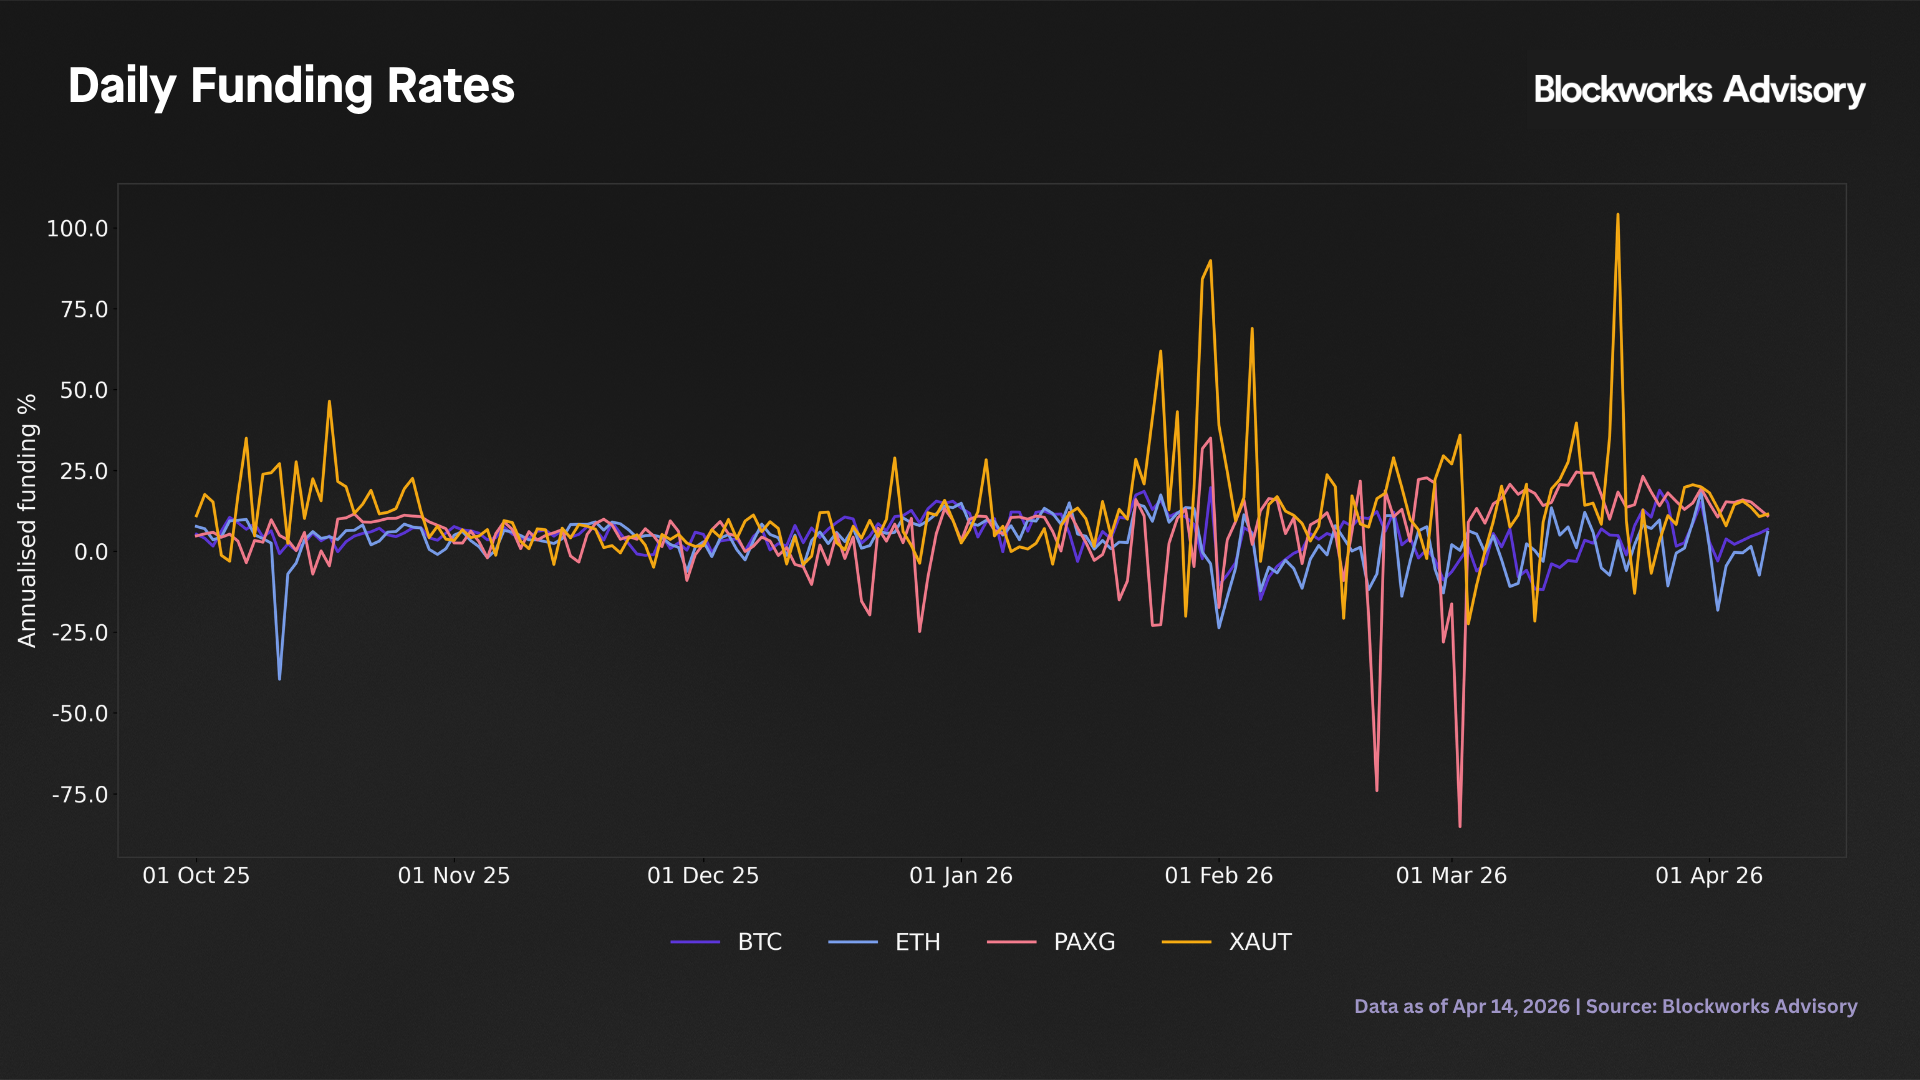
The daily annualised carry series is constructed in three steps. Within each calendar day, all raw settlement rates for a given (exchange, symbol) pair are summed and the resulting daily carry fraction is multiplied by 365 and expressed as a percentage. This annualization is applied once, after summing (for four hour settlement schedules six intraday settlements are present). Per venue daily series are then averaged with equal weight to produce the canonical series. The canonical series represents what Ethena's short position would earn in annualised percentage terms on a given day, averaged across the venues where it operates (it is a carry income rate).
The canonical data uses Binance, Bybit, and Bitget only from October 1, 2025 onward. It excludes Coinbase because its 0% equilibrium funding baseline is structurally different from the 0.01% per 8h standard at other venues, which systematically depresses the equal weight average below the rates Ethena would capture on its primary counterparties. The October 2025 start date reflects market maturation since prior to that, gold perps had only two active venues (Bitget, Bybit), thin OI and extreme funding spikes. The mature market canonical is the policy relevant series for onboarding sizing discussions, while the full overlap canonical is retained for research context.
Funding rate characteristics
Over the observed window, PAXG averaged 5.8% annualised carry with a standard deviation of 13.3%. XAUT averaged 12.4% with a standard deviation of 16.1%. Both are substantially more volatile relative to their means than the BTC and ETH series (std 5.0% and 5.9% respectively). The mean to standard deviation ratio for PAXG is 0.44 and for XAUT is 0.77, compared to 1.04 for BTC and 0.70 for ETH over the same period. Day to day oscillation in gold funding reflects genuine thin market dynamics where a single large position change can move a 4 hour settlement rate dramatically in either direction and the arbitrage corridor back to equilibrium is slower to close than in BTC or ETH markets with ten times the OI.
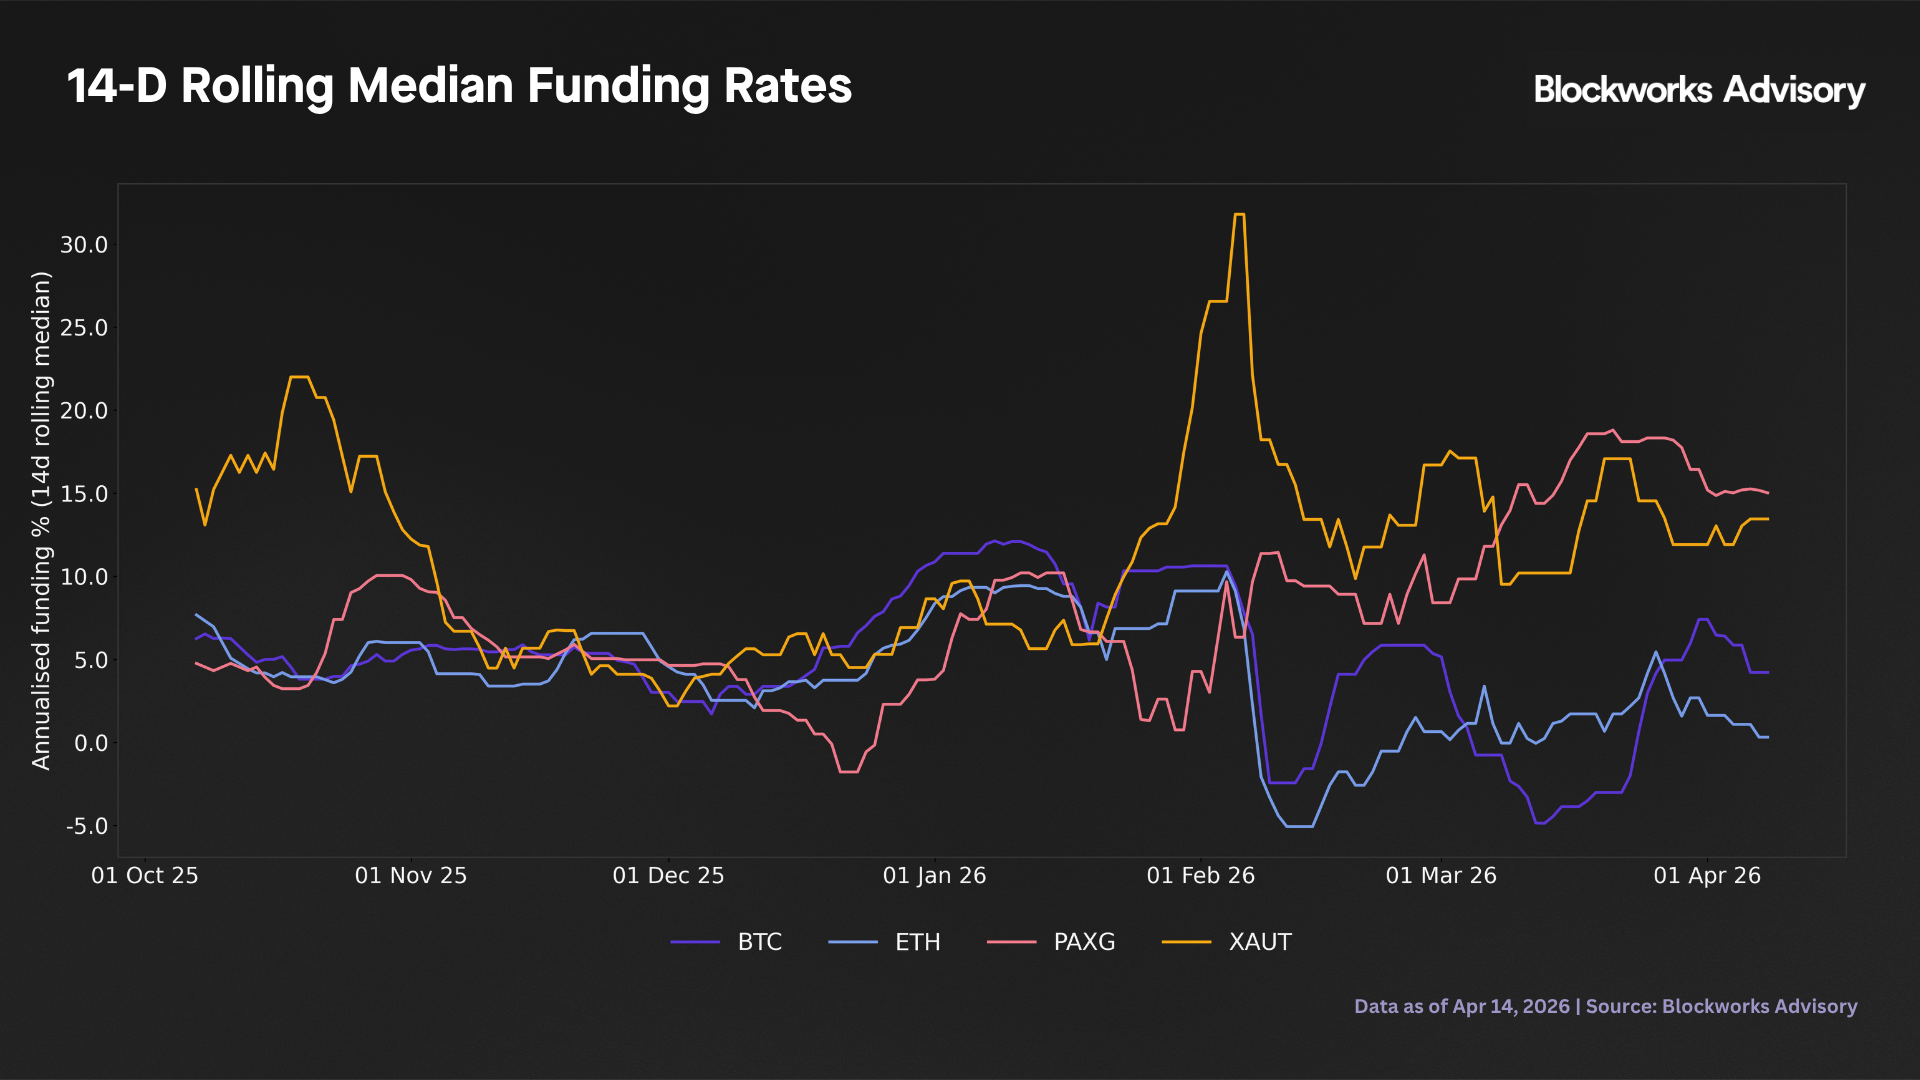
The Kairos Research analysis reports PAXG at 3.6% and XAUT at 5.1% annualised over an approximately equivalent window. The difference relative to our estimates (5.8% and 12.4%) reflects three factors. First, Kairos uses a 14 day rolling median, which compresses volatility by roughly 63% and reduces the arithmetic mean through outlier resistance. Second, Kairos includes OKX XAUT, which ran 2-3 percentage points below Bybit for most of the window and, third, venue weighting differs. The 14 day rolling median is appropriate for governance narratives because it corresponds to the carry realised over a realistic hold period. All statistical analysis in this report, including CVaR, GARCH, correlation and portfolio metrics, uses the raw daily series.
| Metric | PAXG | PAXG (14d median) | XAUT | XAUT (14d median) |
|---|---|---|---|---|
| Mean (ann. %) | 5.8% | 7.8% | 12.4% | 11.2% |
| Median (ann. %) | 7.0% | 7.0% | 9.5% | 11.3% |
| Std (ann. %) | 13.3% | 5.0% | 16.1% | 5.9% |
| Min (ann. %) | -85.1% | -1.8% | -22.4% | +2.2% |
| Max (ann. %) | +35.0% | +18.8% | +104.2% | +31.8% |
| % positive days | 82.1% | 96.7% | 88.9% | 100.0% |
| Std reduction vs raw | - | -62.6% | - | -63.6% |
| CVaR 5% (ann. %) | -33.1% | -0.4% | -12.8% | +3.6% |
Negative funding is more frequent in gold but shorter in duration than in crypto. PAXG experienced 22 separate negative carry episodes over the mature market window (190 days), each averaging 1.5 days. XAUT had 18 episodes averaging 1.2 days. Both are consistent with thin market supply-demand imbalances that resolve. Importantly, the 82.1% and 88.9% positive carry frequencies compare favourably with BTC (88.1%) and ETH (84.6%), gold is positive carry most of the time in this window.
Regime dynamics and counter cyclicality
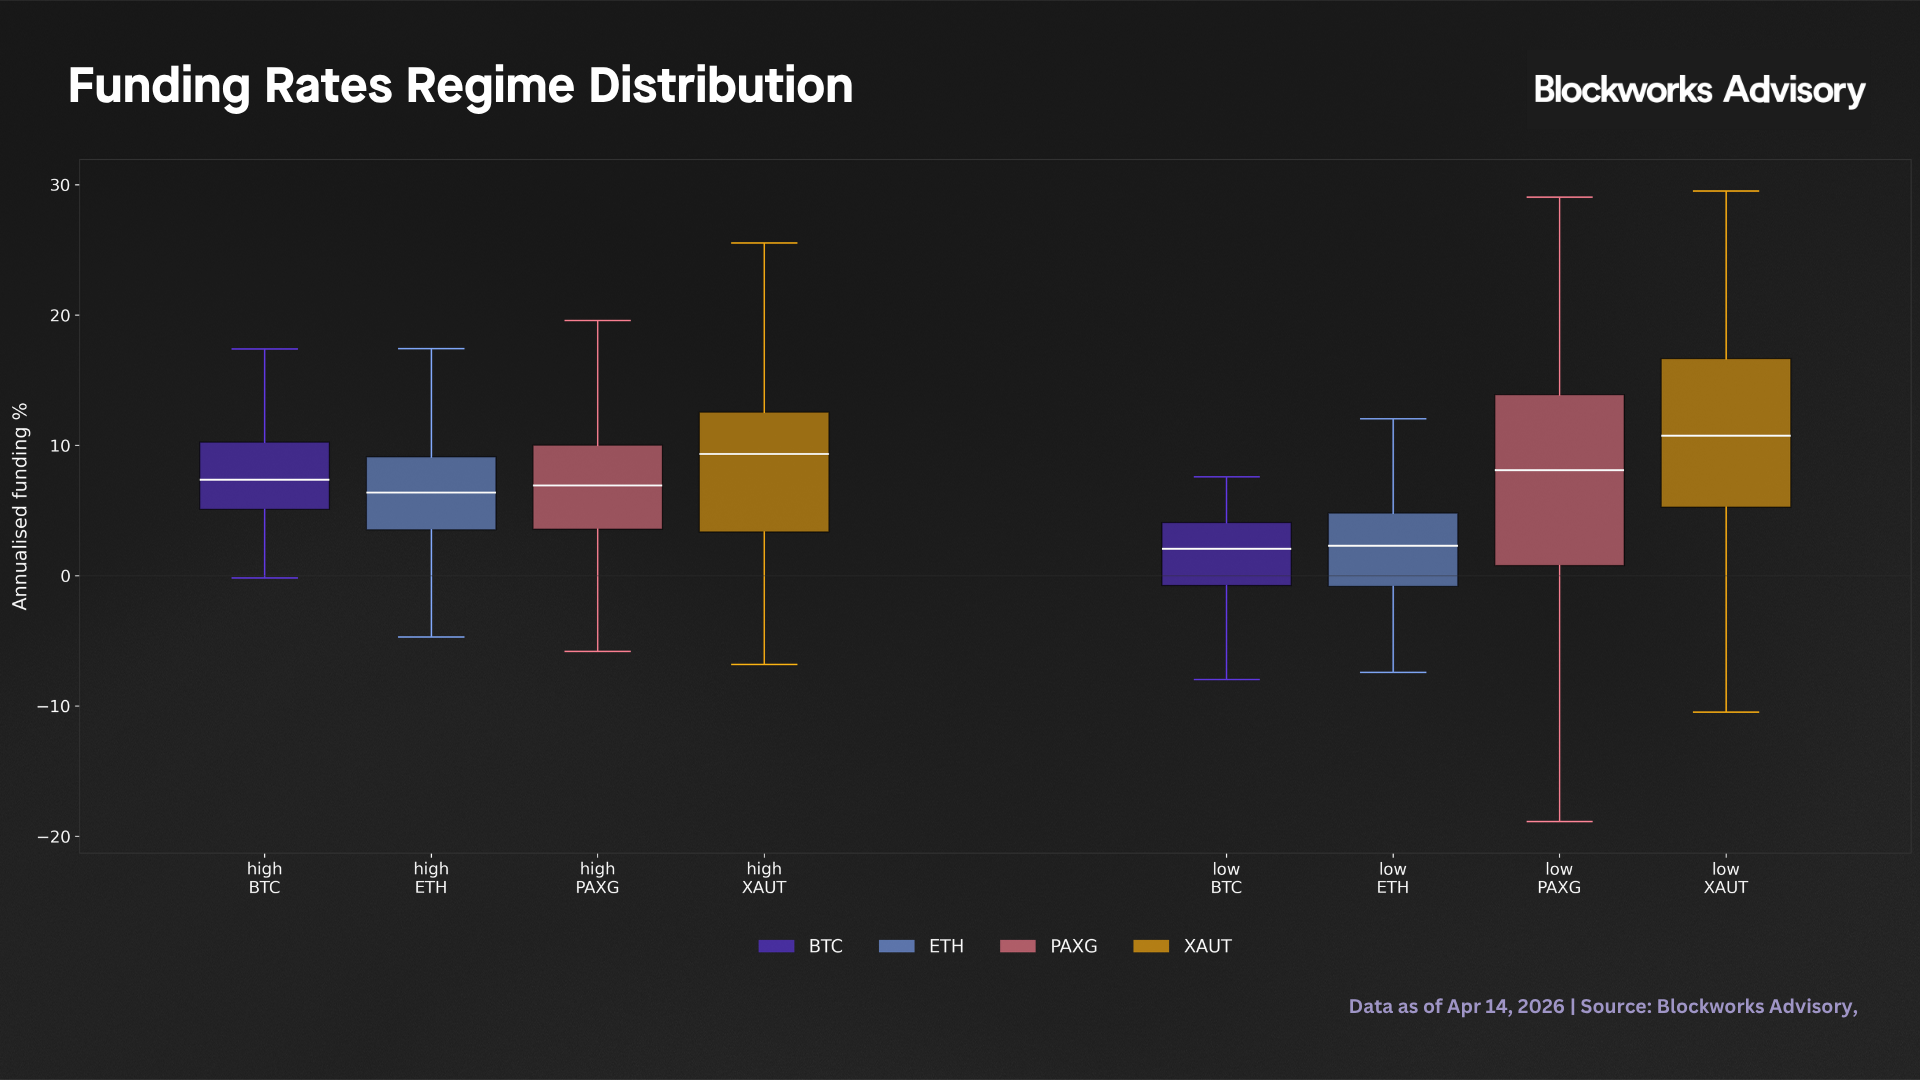
A Gaussian Hidden Markov Model fitted to the BTC canonical daily funding rate on the overlap window (April 2025-April 2026) identifies two distinct states: a high funding state (61.2% of days, mean 7.5% annualised) and a compressed carry state (38.8%, mean 1.4%). Expected durations are 21 days for the high state and 13 days for the low state, consistent with multi week funding cycles driven by positioning dynamics. The low state does not represent negative funding (BTC carry remains marginally positive) but identifies the environment where sUSDe yield is most at risk.
The counter cyclicality question is whether gold funding compensates for crypto funding compression. The data provides a directionally consistent answer across both assets. PAXG averaged 6.8% annualised during the 144 BTC low regime days compared to 5.8% during the 227 high regime days (+1.0 percentage points). XAUT averaged 12.3% during the low regime versus 9.0% during the high regime (+3.3 percentage points). The formal statistical test produces p=0.38 for PAXG (insufficient evidence) and p=0.056 for XAUT, narrowly outside the 5% threshold. Cohen’s d for XAUT is 0.21, a small effect that would require approximately 350 observations per group to detect at 80% power. The current 144 low regime days are insufficient. The result should be read as directional evidence.
| Asset | High funding regime (n=227 days) | Low funding regime (n=144 days) | Difference | Welch p-value |
|---|---|---|---|---|
| BTC | 7.6% | 1.3% | -6.3pp | - |
| ETH | 6.2% | 0.9% | -5.2pp | - |
| PAXG | 5.8% | 6.8% | +1.0pp | 0.38 |
| XAUT | 9.0% | 12.3% | +3.3pp | 0.056 |
Mean annualised carry by BTC 2 state HMM regime. The BTC and ETH rows illustrate the magnitude of the crypto carry compression in the low regime (-6.3pp and -5.2pp respectively), against which the gold carry premium of +1.0pp to +3.3pp is positioned. Welch's t-test; two-tailed.
The regime conditional correlation structure reinforces the counter cyclicality interpretation. During the BTC low funding regime, BTC-PAXG Pearson correlation collapses to 0.039 (p=0.645) and BTC-XAUT to 0.066 (p=0.433), neither statistically distinguishable from zero. During the high funding regime, both are slightly positive (BTC-PAXG 0.077 with p=0.245, BTC-XAUT 0.153 with p=0.021). Gold funding is not only higher when BTC funding is compressed, but also less correlated with BTC dynamics at precisely that time. This conditional structure is more useful for portfolio construction than the unconditional correlation alone.
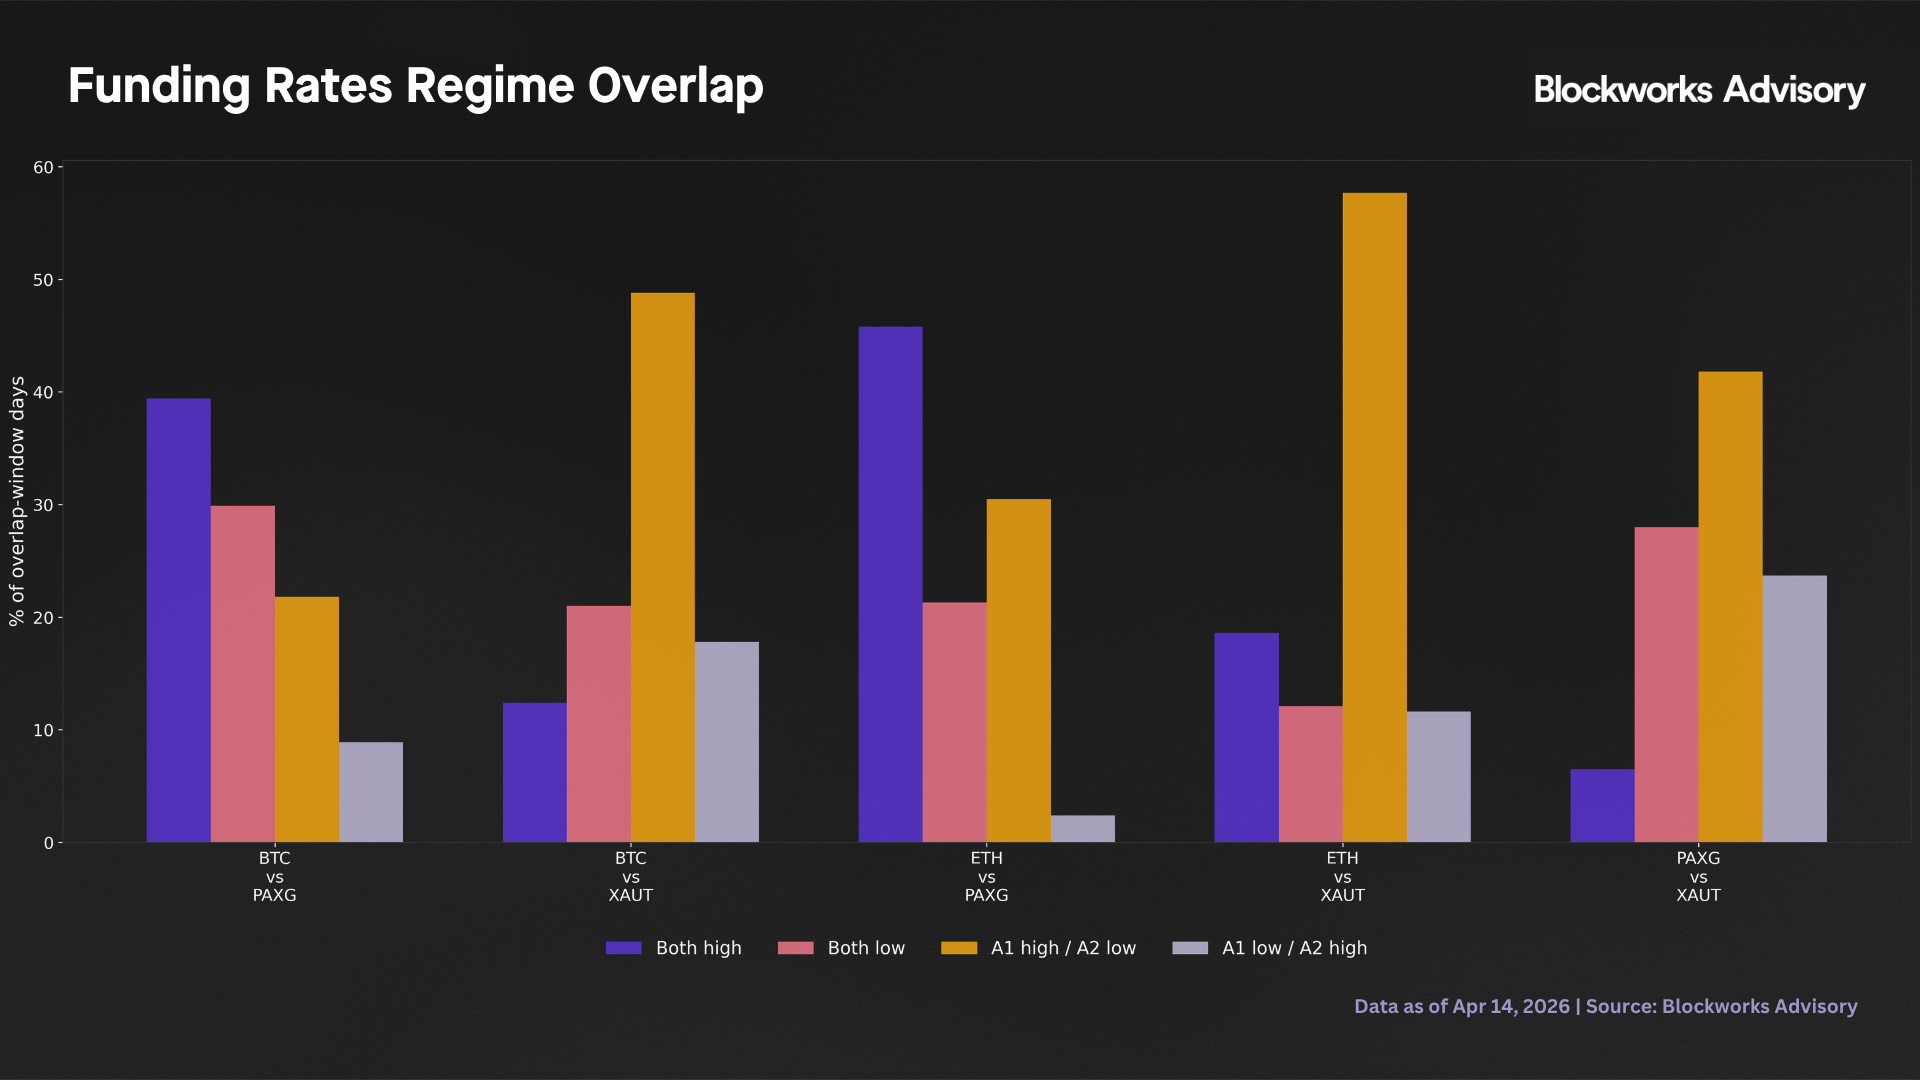
The regime overlap matrix above extends this analysis using per asset independent HMMs, where each asset’s own funding series is classified into its own high and low states. The bars labelled “A1 high / A2 low” show the share of days when the first asset is in its own high funding regime while the second is in its own low funding regime. For BTC versus XAUT, this bar reaches approximately 49%, confirming that when BTC funding is running high, XAUT is more often in a relatively subdued funding state. This cross asset regime asynchrony is the structural basis for the portfolio diversification benefit.
Correlation structure
Full period Pearson correlations between crypto and gold daily annualised carry are near zero with BTC-PAXG 0.014, BTC-XAUT 0.020, ETH-XAUT -0.037. BTC-ETH is 0.560, reflecting shared crypto cycle exposure. None of the crypto-gold correlations is statistically significant at 5%. The underlying driver is that crypto perp funding reflects positioning demand for leveraged crypto price exposure, while gold perp funding reflects speculative demand for leveraged exposure to gold which is an asset class driven by real interest rates, central bank purchases, and safe haven flows with minimal day to day correlation to Bitcoin price movements.
| BTC | ETH | PAXG | XAUT | |
|---|---|---|---|---|
| BTC | 1.000 | 0.560 | 0.014 | 0.020 |
| ETH | 0.560 | 1.000 | 0.114 | -0.037 |
| PAXG | 0.014 | 0.114 | 1.000 | 0.082 |
| XAUT | 0.020 | -0.037 | 0.082 | 1.000 |
Pearson correlation matrix, full overlap window (371 days).
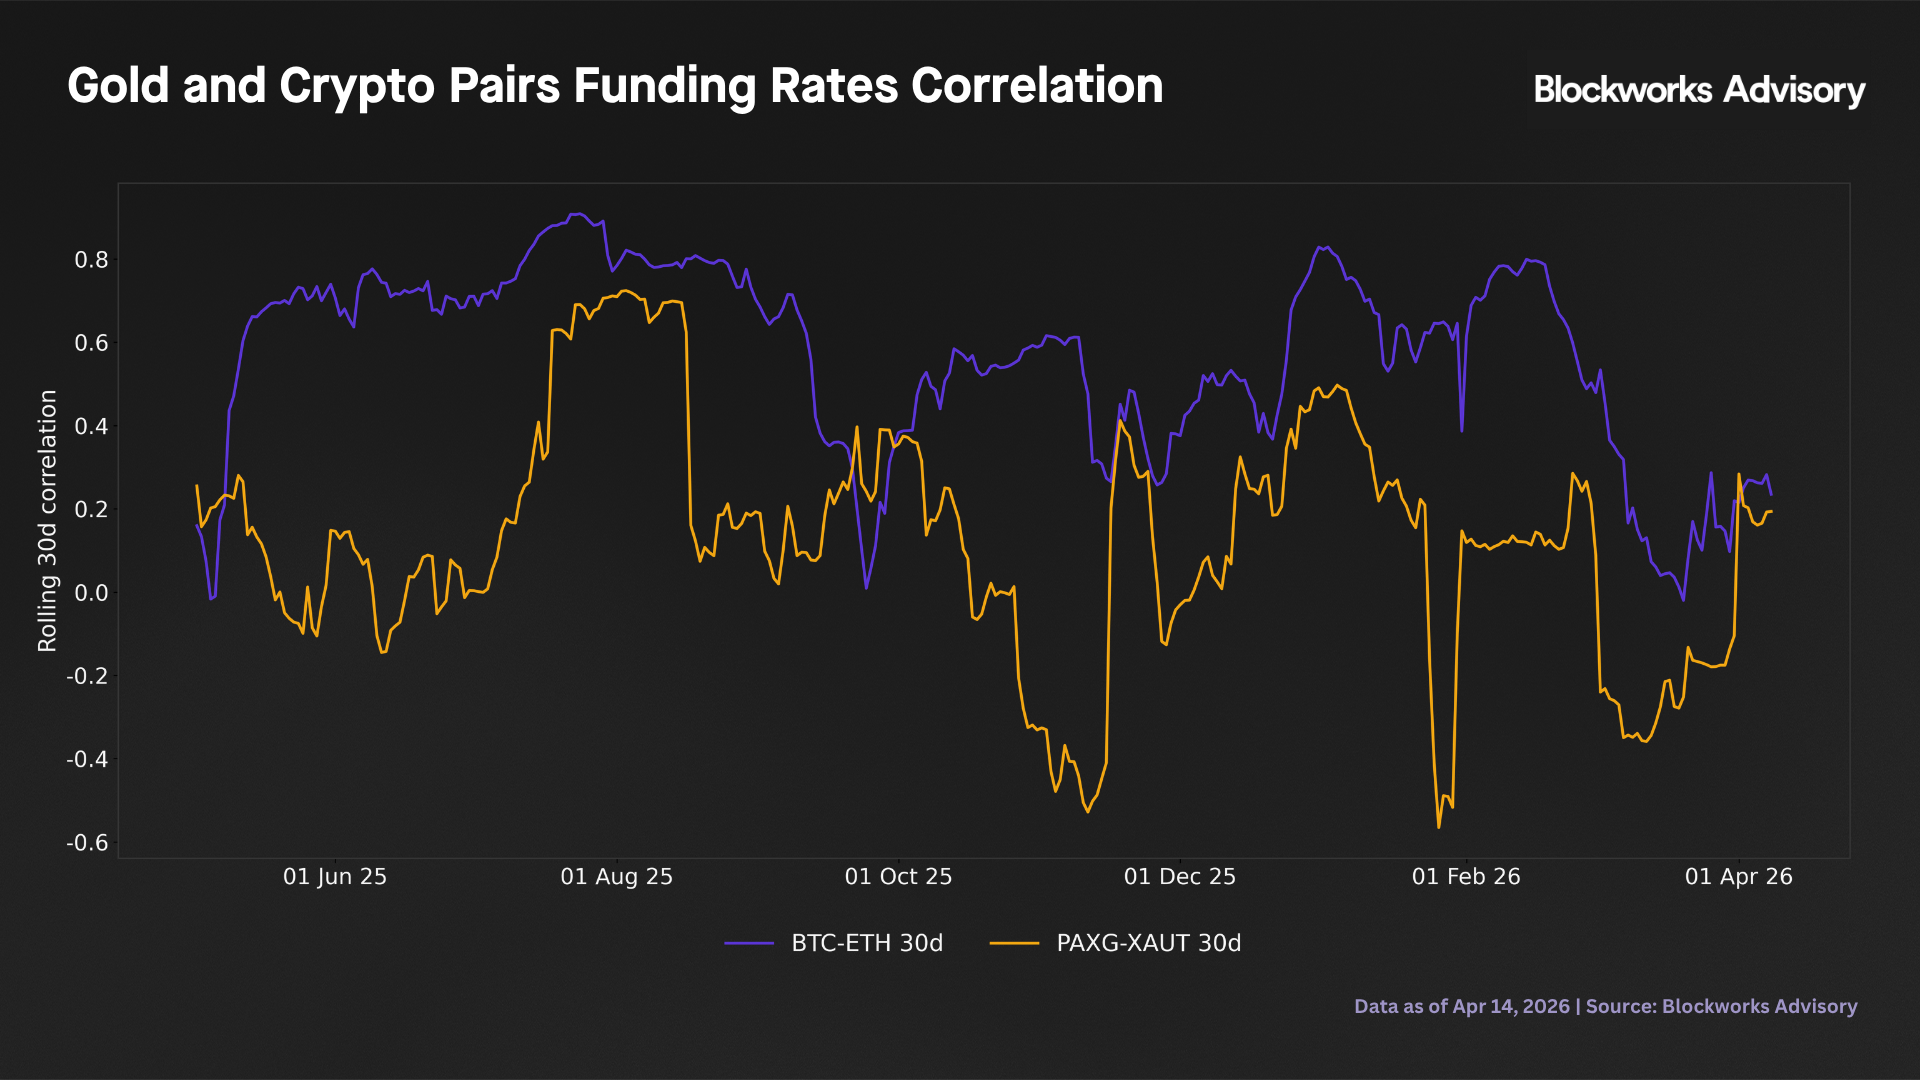
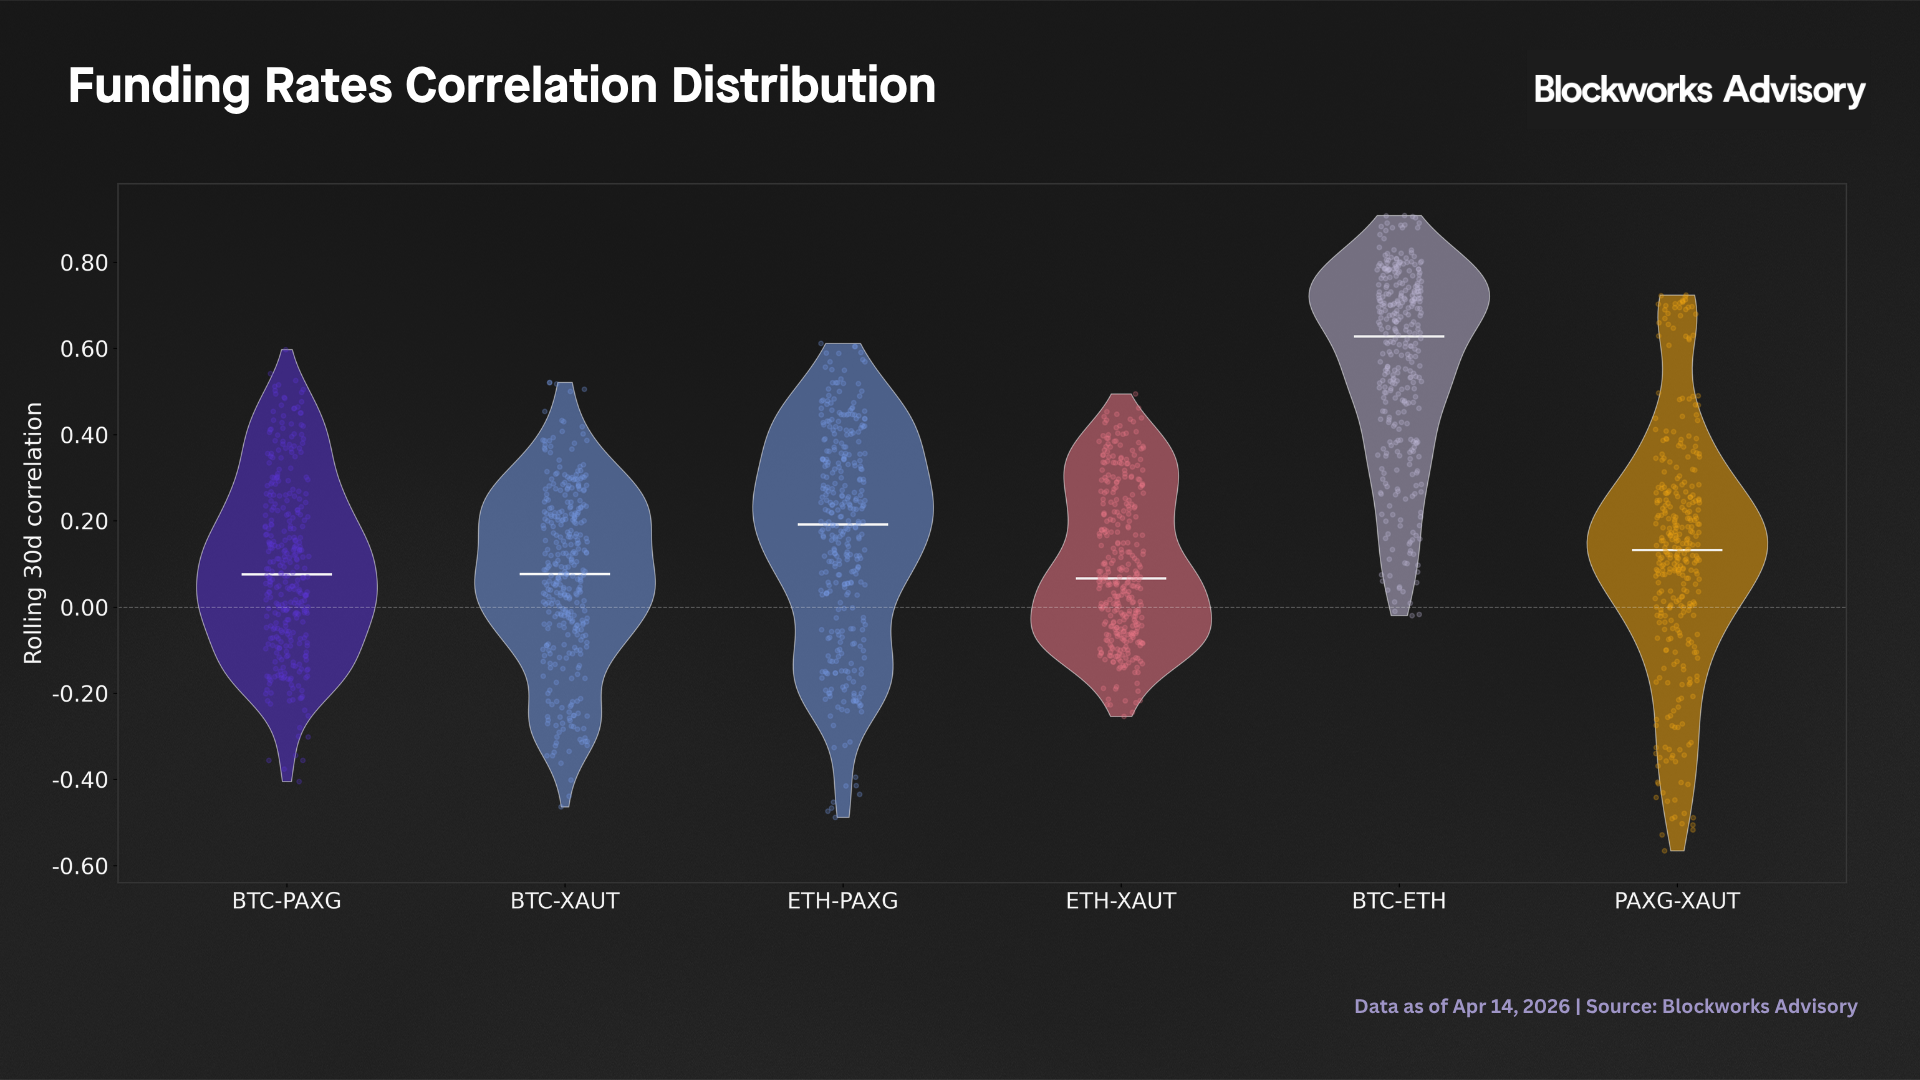
The static correlations mask substantial time variation. Rolling 30 day BTC-PAXG correlation oscillates between approximately -0.5 and +0.6 over the 12 month window (cycling sign multiple times). The long run average is near zero but the monthly experience varies materially. This episodic instability means the diversification benefit is not guaranteed in any particular month, even though it holds statistically over the full period.
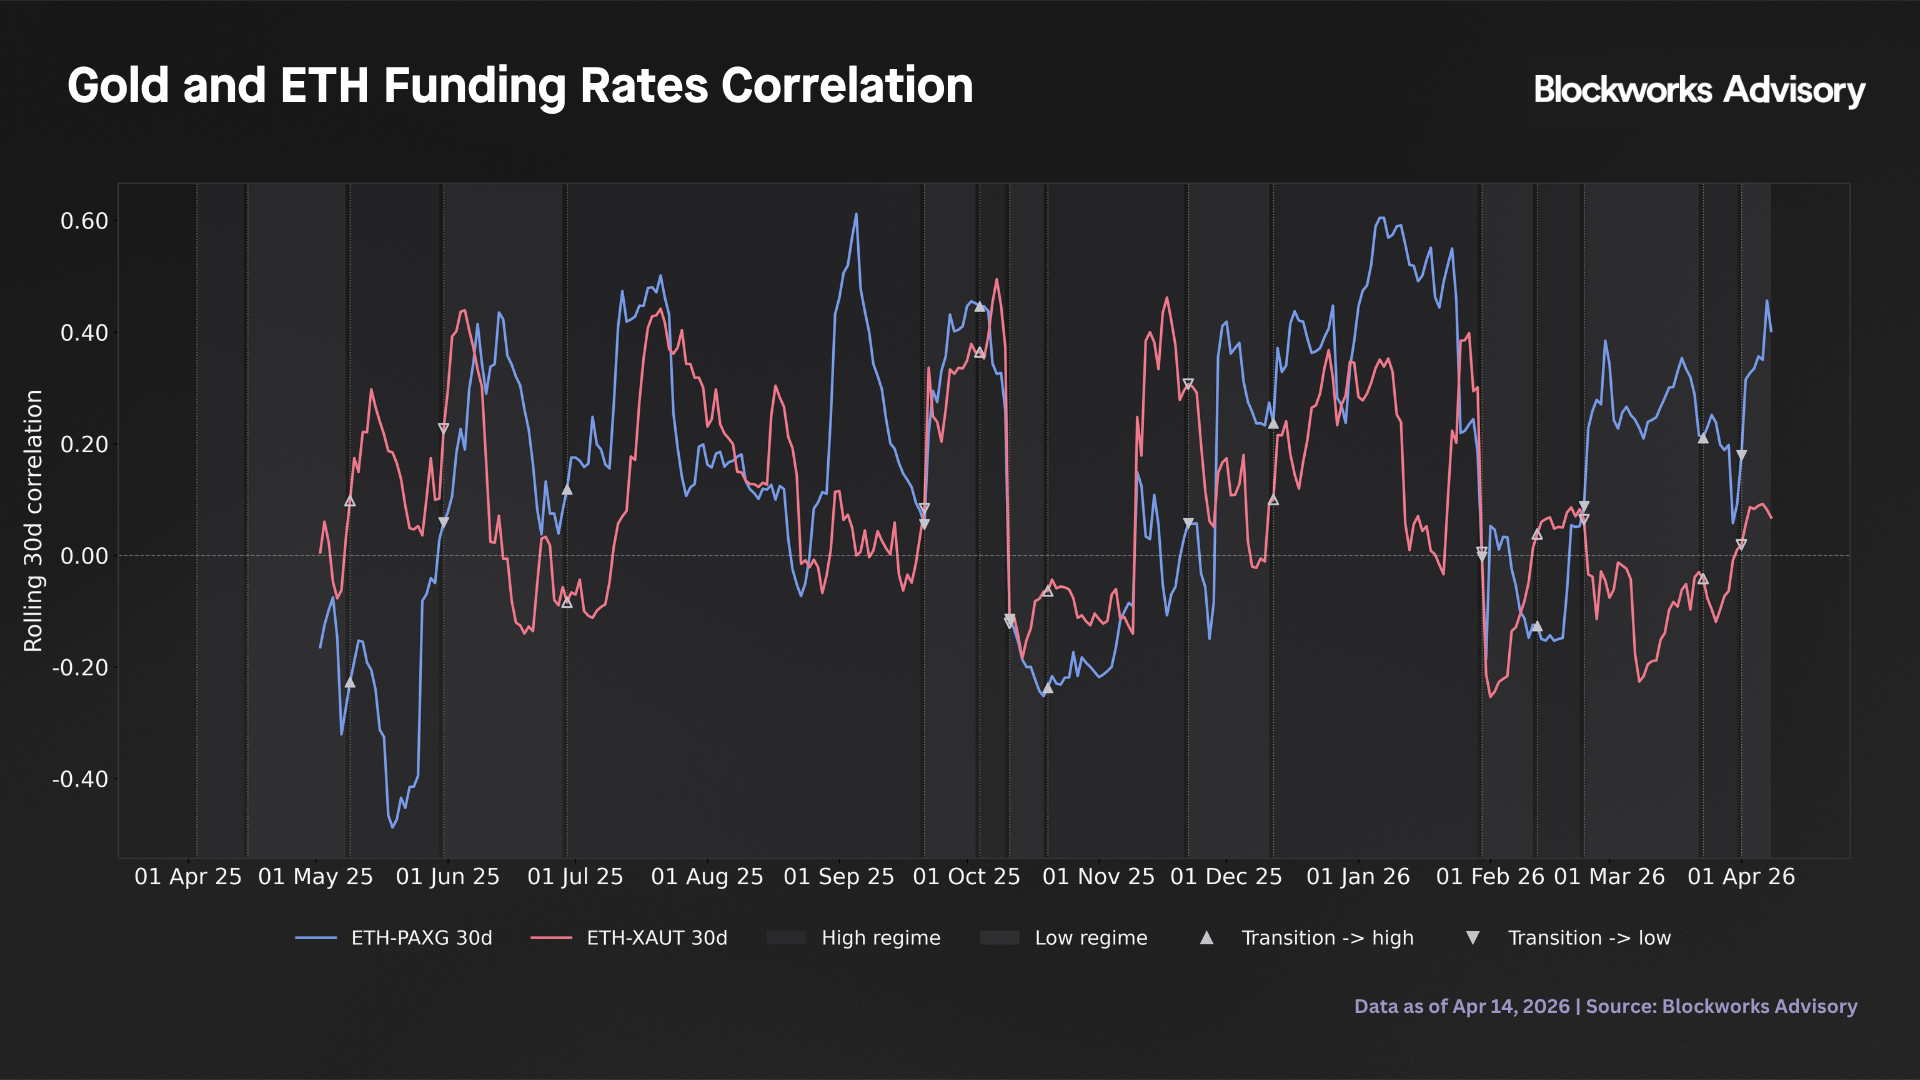
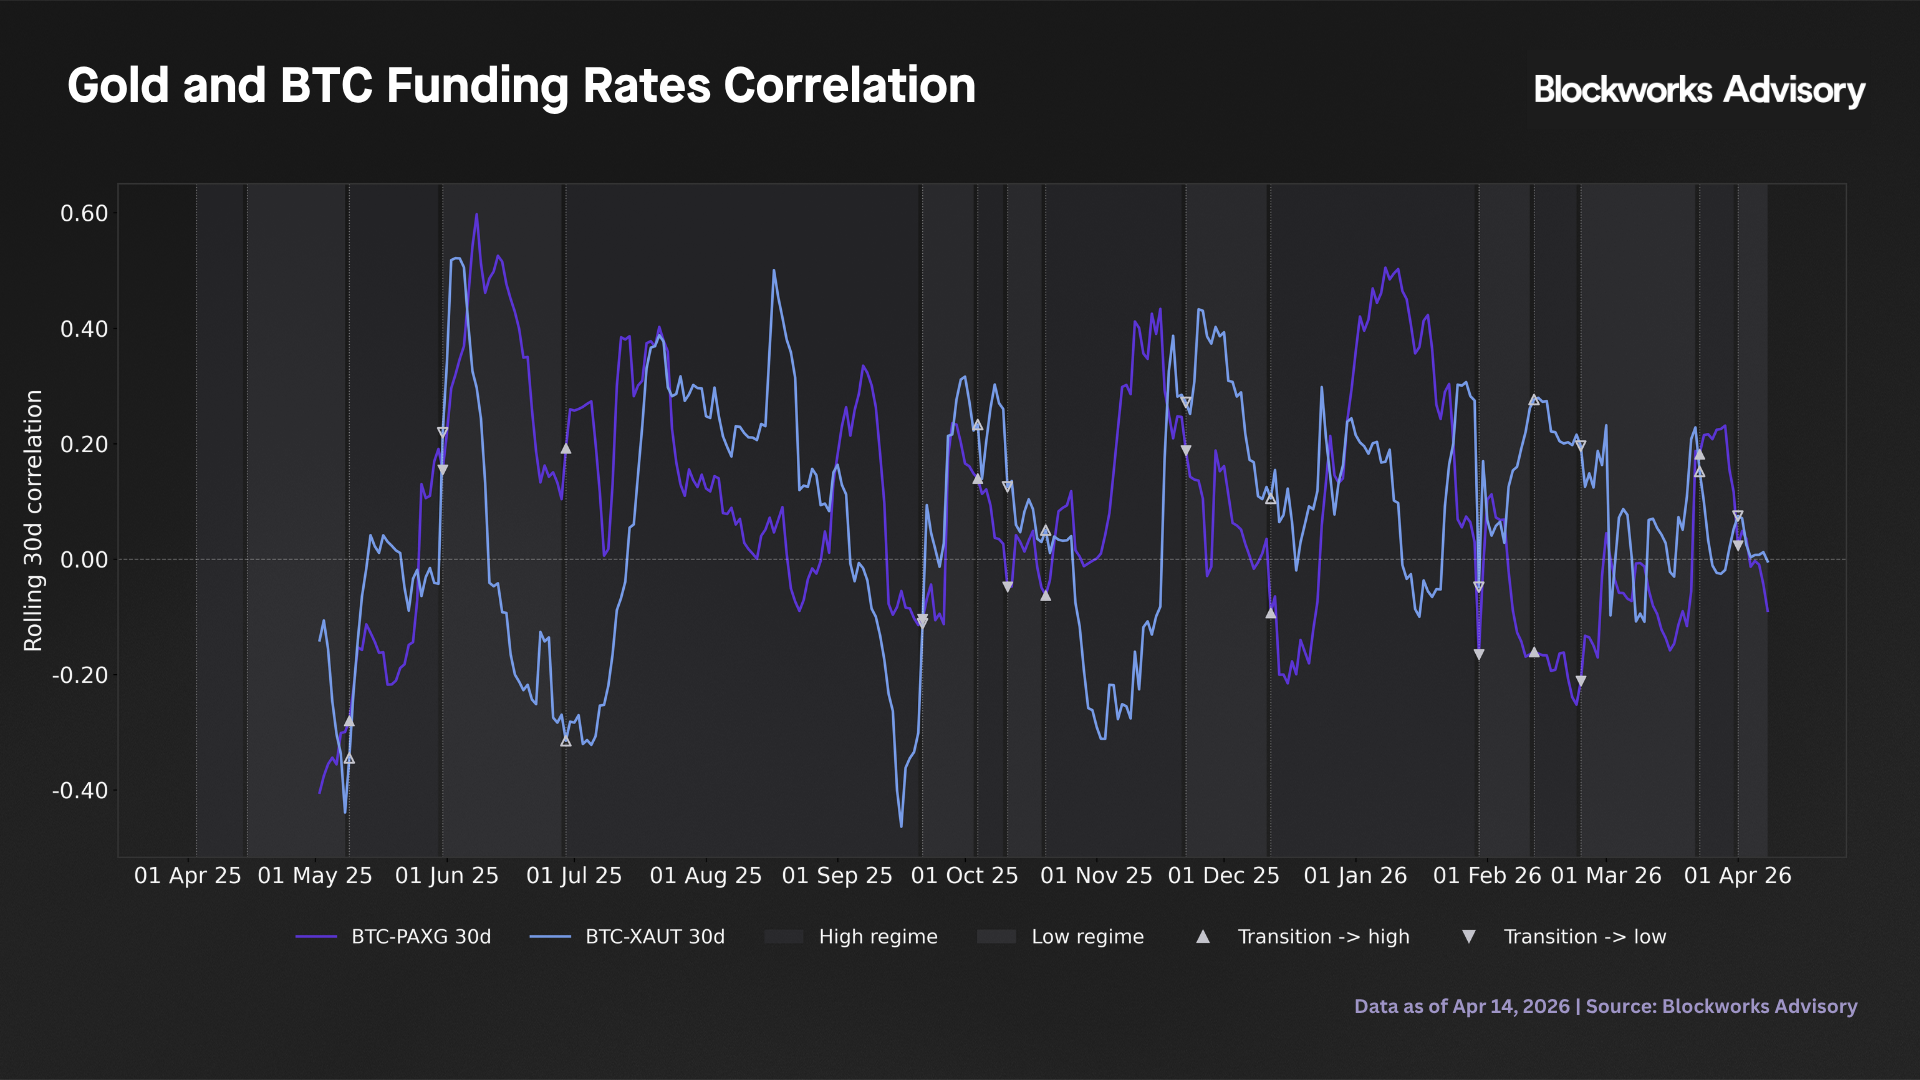
The regime conditional analysis in the preceding section provides a more stable characterisation by conditioning the correlation estimate on the prevailing funding environment. The four charts below show: (1) BTC-ETH and PAXG-XAUT rolling correlations with BTC-ETH staying persistently at 0.6-0.9 throughout while PAXG-XAUT is volatile between -0.6 and +0.7, confirming that even two gold tokens have distinct venue and timing dynamics and should be sized independently; (2) ETH-gold rolling correlations, which show a similar pattern to BTC-gold with ETH-PAXG averaging somewhat higher positive values consistent with its static correlation of 0.114; (3) BTC-gold rolling correlations with regime shading and transition markers and (4) violin plots of the full distribution of rolling correlations across all six pairs, where the BTC-ETH violin is centred near 0.6 and barely touches zero while all four crypto-gold violins straddle zero symmetrically, confirming near zero long-run correlations are a genuine structural property.
Portfolio construction
The portfolio framework models Ethena's basis book as a weighted combination of daily annualised carry series, where weights reflect backing asset allocation fractions. Portfolio return is the weighted sum and portfolio volatility is the square root of the weighted covariance. This is appropriate because the funding rate is Ethena’s primary carry income: its volatility directly measures the day to day stability of sUSDe yield and diversification in this setting measures the reduction of the yield frequency compression visible to depositors.
Five portfolios illustrate the allocation landscape. P1 is the baseline equal weight BTC-ETH book. P2, P3, and P4 add 20% PAXG, 20% XAUT, or 10% each, funded pro rata from both crypto positions. P5 is the minimum variance portfolio derived analytically via constrained optimisation.
| Portfolio | BTC / ETH / PAXG / XAUT | Mean carry | Vol | Sharpe | Sortino | CVaR 5% | Div. ratio |
|---|---|---|---|---|---|---|---|
| P1: 50/50 crypto | 50 / 50 / 0 / 0 | 4.66% | 4.79% | 18.6 | 18.9 | -7.9% | 1.13 |
| P2: +20% PAXG | 40 / 40 / 20 / 0 | 4.97% | 4.48% | 21.2 | 20.1 | -6.9% | 1.42 |
| P3: +20% XAUT | 40 / 40 / 0 / 20 | 5.80% | 4.68% | 23.7 | 39.2 | -4.4% | 1.51 |
| P4: +10% each | 40 / 40 / 10 / 10 | 5.38% | 4.27% | 24.1 | 30.1 | -4.9% | 1.57 |
| P5: min variance | 55 / 22 / 14 / 9 | 5.54% | 4.16% | 25.4 | 34.2 | -4.3% | 1.60 |
Full overlap window (April 2025-April 2026, n=371 days). Sharpe and Sortino are annualised from daily units. Diversification ratio (DR) = weighted average individual vol / portfolio vol. CVaR 5% is the expected daily carry in the worst 5% of portfolio days.
Each step away from the baseline improves portfolio efficiency. Moving from P1 to P4 raises mean carry by 72 basis points while reducing volatility by 52 basis points, a combination that is only achievable because the added assets are nearly orthogonal to the existing book. The minimum variance portfolio (P5) achieves the most significant risk reduction, at 4.16% portfolio volatility it is 13% below P1, with a diversification ratio of 1.60 indicating that portfolio volatility is 37% below the weighted average of individual volatilities. A notable property of P5 is that the minimum variance condition forces equal marginal contributions to risk across all four assets. At optimum, each asset contributes to portfolio volatility in exact proportion to its weight. This means PAXG at 14% weight and XAUT at 9% weight each contribute 14% and 9% of total portfolio risk respectively, despite their individual volatilities being two to three times those of BTC and ETH.
The regime conditional breakdown isolates the practically relevant scenario with the 144 BTC low funding days when sUSDe yield is most compressed.
| Portfolio | Low regime mean carry | Low regime vol | Low regime CVaR 5% | vs P1 CVaR |
|---|---|---|---|---|
| P1: 50/50 crypto | 1.1% | 4.60% | -12.4% | - |
| P2: +20% PAXG | 2.3% | 4.48% | -11.0% | +1.4pp |
| P3: +20% XAUT | 3.3% | 4.59% | -6.9% | +5.5pp |
| P4: +10% each | 2.8% | 4.13% | -7.9% | +4.5pp |
| P5: min variance | 2.9% | 3.97% | -7.1% | +5.3pp |
Low funding regime: 144 days when the BTC 2 state HMM is in the compressed state (mean BTC carry 1.4% annualised). The +5.5pp CVaR improvement from P3 means the expected carry shortfall in the worst 5% of low regime days improves from -12.4% to -6.9%.
During the 144 low regime days, the pure crypto book earned only 1.1% annualised mean carry ( the scenario most likely to generate depositor concern). Adding 20% XAUT raises mean carry to 3.3% while adding 20% PAXG to 2.3% and the minimum variance portfolio (P5) achieves 2.9%. None fully insulates against the compression, but all represent a meaningful yield floor that pure crypto exposure cannot provide. The CVaR improvement at P5 (from -12.4% to -7.1%) is practically significant since it reduces the severity of the worst 5% of low regime days by 43%.
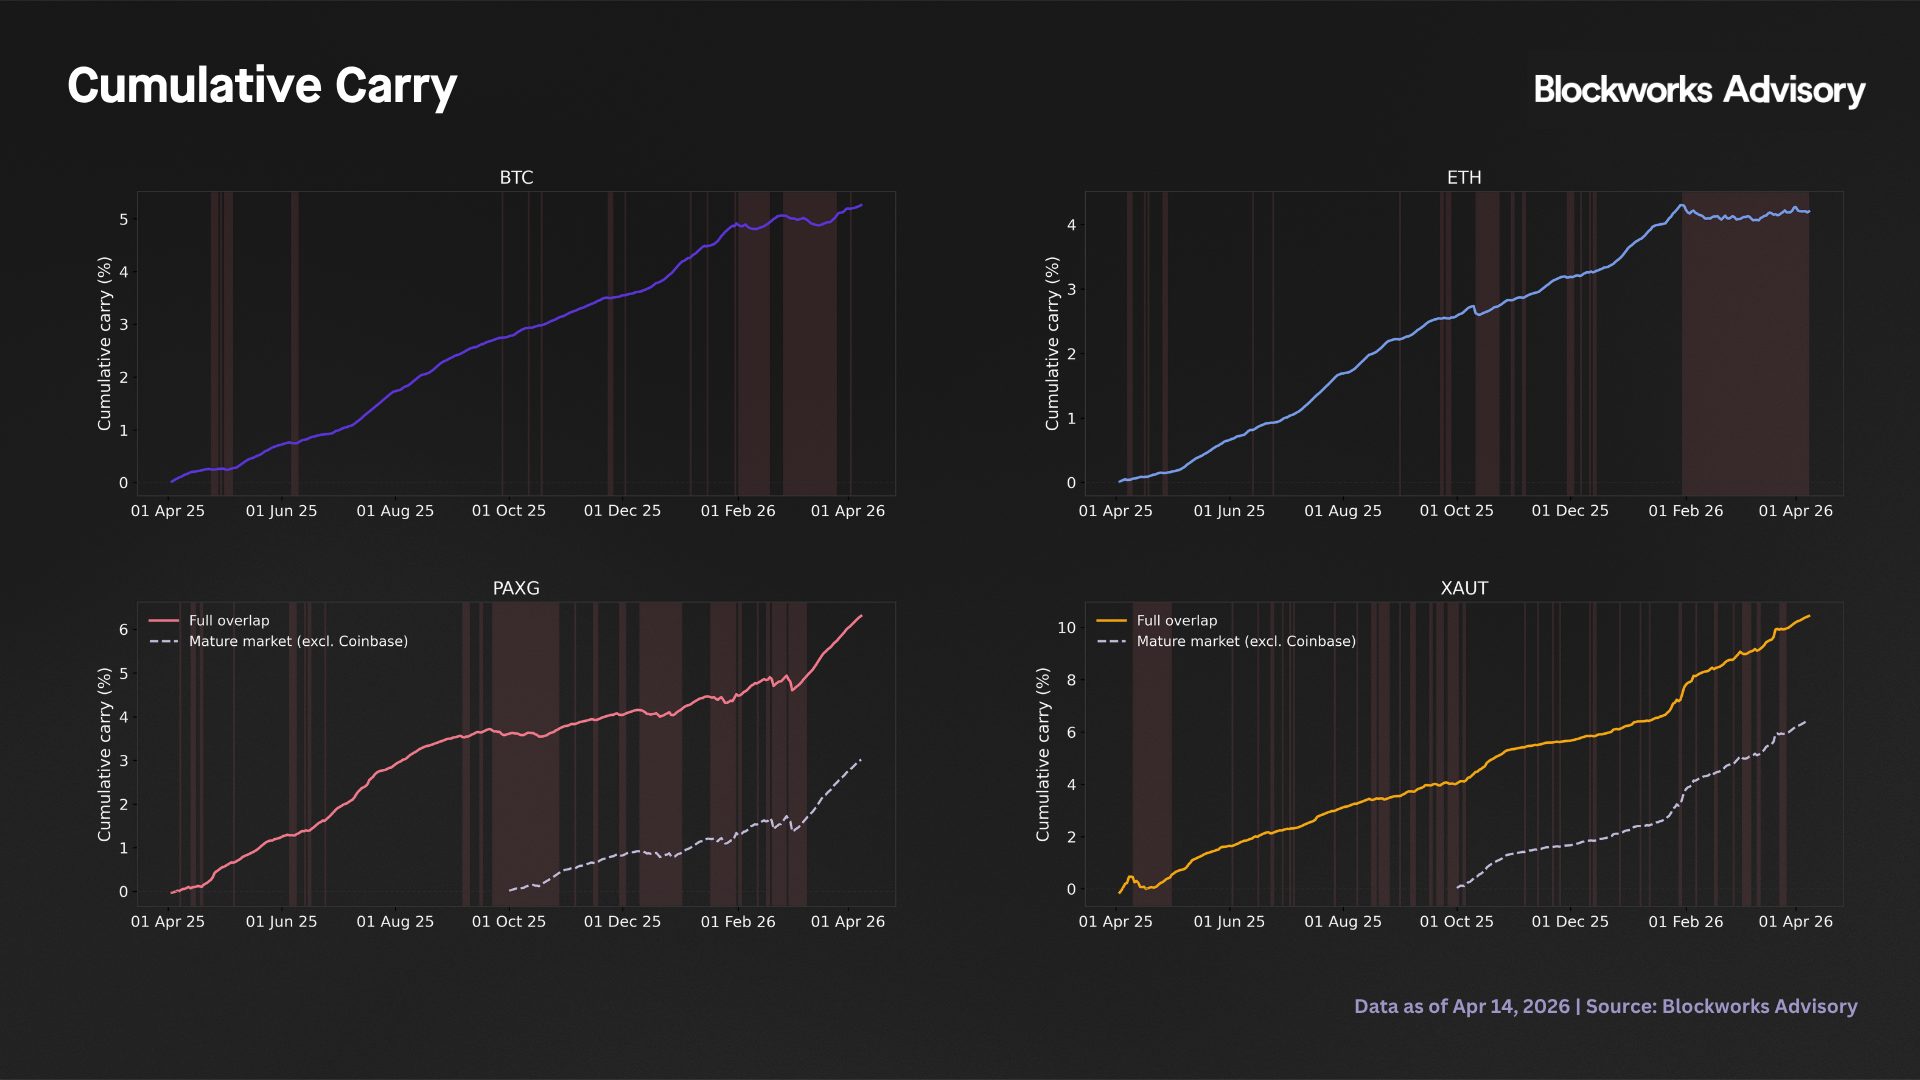
The cumulative carry panels below show total carry income accrued from April 2025 onward. BTC and ETH cumulative carry visibly flattens during the shaded low regime periods; PAXG and XAUT continue accumulating through the same episodes which is the clearest visual summary of the counter cyclicality property in this dataset. The gold panels also overlay the mature market canonical series (dashed line, October 2025 onward, Binance/Bybit/Bitget only), illustrating the divergence from the full overlap series during the thin market early period and confirming that the post maturation carry trajectory is the relevant baseline for onboarding sizing.
Risk considerations
Three risk dimensions are material to any implementation decision.
- Funding rate volatility and Reserve Fund sizing. The CVaR at the 5th percentile for the PAXG raw daily canonical is -33.1% annualised. This means that in the worst 5% of days (approximately 9-10 days out of 190), the expected carry on a PAXG basis position was -33.1% or worse annualised. On a $25M notional short position, the expected daily cash outflow on such days is approximately $25M × 33.1% / 365 = $22,700. The XAUT equivalent is -12.8% ($8,800/day). A Reserve Fund buffer for a $25M PAXG position calibrated to cover 5-7 days of carry at the CVaR rate implies a buffer of roughly $115,000-$160,000, or 0.5-0.6% of notional. This is a provisional estimate based on the current 190 day sample and should be updated as market history deepens.
- Market thinness and venue concentration. PAXG open interest across Binance, Bybit and Bitget stood at approximately $205M and XAUT at $293M as of April 2026. Both are an order of magnitude below BTC and ETH perp markets. The practical consequences are higher sign flip frequency (PAXG 23.3%, XAUT 21.9% versus BTC 10.8%), more severe single day spikes and greater sensitivity to position size in OI to position ratio terms. The analysis in this report captures only the carry income component of the basis trade. Spot premium/discount of PAXG and XAUT relative to gold NAV and execution slippage on position entry and exit are separate risk factors that require independent quantification.
- Sample length and macro regime representativeness. The overlap window of 371 days spans a single macro episode where gold shows a bull market (gold approximately $3,000 to $5,600 before correcting to $4,666), moderate crypto conditions and no sustained gold price decline. The counter cyclicality finding has not been tested through a gold bear market, which has not occurred during the data window. The correlation and regime statistics should be treated as conditional on the current macro environment and updated as the gold perp market matures through a full cycle.
Conclusions
This analysis establishes the following empirical findings as the quantitative basis for the committee's deliberation on gold basis trading.
Gold and crypto perpetual funding rates are structurally near uncorrelated. The full period BTC-PAXG correlation is 0.014 and BTC-XAUT is 0.020. Rolling 30 day correlations oscillate between -0.5 and +0.6, meaning the diversification benefit is not guaranteed monthly but holds statistically over multi month horizons. Regime conditional correlations collapse further toward zero in the BTC compressed carry state, precisely when the diversification property is most needed.
Gold funding is directionally counter cyclical to crypto funding. XAUT averaged 3.3 percentage points higher during BTC low funding periods than during high-funding periods and PAXG 1.0 percentage points higher. The result is directional and consistent across both assets, though the formal statistical test remains underpowered at the current sample size (therefore the analysis should be repeated as market history deepens).
Adding gold basis to the existing crypto book improves the portfolio’s mean variance profile. The minimum variance portfolio (55% BTC, 22% ETH, 14% PAXG, 9% XAUT) achieves 4.16% carry volatility (13% below the crypto-only baseline) while delivering 5.54% mean carry, 88 basis points above it. The risk profile is more demanding, PAXG CVaR at the 5th percentile is -33.1% annualised and XAUT -12.8%, compared to -7.9% for the baseline equal weight crypto portfolio. Gold negative carry episodes are short lived (average 1.2-1.5 days) but severe, and Reserve Fund sizing for any gold basis position must be anchored to the raw daily CVaR.
Back to Insights
Newsletter
The Breakdown
Decoding crypto and the markets. Daily, with Byron Gilliam.
Blockworks Research
Unlock crypto's most powerful research platform.
Our research packs a punch and gives you actionable takeaways for each topic.
Blockworks Inc.
133 W 19th St., New York, NY 10011
Blockworks Network